
The Human Development Index (HDI) is a statistic composite index of life expectancy, education (literacy rate, gross enrollment ratio at different levels and net attendance ratio), and per capita income indicators, which are used to rank countries into four tiers of human development. A country scores a higher HDI when the lifespan is higher, the education level is higher, and the gross national income GNI (PPP) per capita is higher. It was developed by Pakistani economist Mahbub ul Haq and was further used to measure a country’s development by the United Nations Development Programme (UNDP)’s Human Development Report Office.
The 2010 Human Development Report introduced an Inequality-adjusted Human Development Index(IHDI). While the simple HDI remains useful, it stated that “the IHDI is the actual level of human development (accounting for inequality), while the HDI can be viewed as an index of ‘potential’ human development (or the maximum level of HDI) that could be achieved if there were no inequality.”
The index is based on the human development approach, developed by Mahbub ul Haq, often framed in terms of whether people are able to “be” and “do” desirable things in life. Examples include – being: well fed, sheltered, healthy; doing: work, education, voting, participating in community life. The freedom of choice is central – someone choosing to be hungry (as during a religious fast) is quite different from someone who is hungry because they cannot afford to buy food, or because the country is in a famine.
The index does not take into account several factors, such as the net wealth per capita or the relative quality of goods in a country. This situation tends to lower the ranking for some of the most advanced countries, such as the G7 members and others.
Origins

Mahbub ul Haq
The origins of the HDI are found in the annual Human Development Reports produced by the Human Development Report Office of the United Nations Development Programme (UNDP). These were devised and launched by Pakistani economist Mahbub ul Haq in 1990, and had the explicit purpose “to shift the focus of development economics from national income accounting to people-centered policies”. Haq believed that a simple composite measure of human development was needed to convince the public, academics, and politicians that they can and should evaluate development not only by economic advances but also improvements in human well-being.
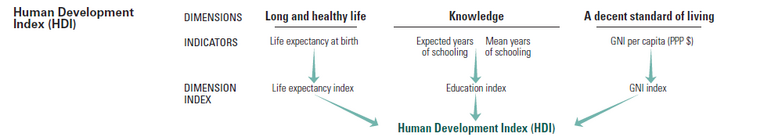
The underlying principles behind the Human Development Index.
Dimensions and calculation
New method (2010 HDI onwards)
Published on 4 November 2010 (and updated on 10 June 2011), the 2010 Human Development Report calculated the HDI combining three dimensions:
- A long and healthy life: Life expectancy at birth
- Education index: Mean years of schooling and Expected years of schooling
- A decent standard of living: GNI per capita (PPP international dollars)
In its 2010 Human Development Report, the UNDP began using a new method of calculating the HDI. The following three indices are used:
1. Life Expectancy Index (LEI) {\displaystyle ={\frac {{\textrm {LE}}-20}{85-20}}}

-
- LEI is 1 when Life expectancy at birth is 85 and 0 when Life expectancy at birth is 20.
2. Education Index (EI) {\displaystyle ={\frac {{\textrm {MYSI}}+{\textrm {EYSI}}}{2}}}

- 2.1 Mean Years of Schooling Index (MYSI) {\displaystyle ={\frac {\textrm {MYS}}{15}}}
- Fifteen is the projected maximum of this indicator for 2025.
- 2.2 Expected Years of Schooling Index (EYSI) {\displaystyle ={\frac {\textrm {EYS}}{18}}}
- Eighteen is equivalent to achieving a master’s degree in most countries.


3. Income Index (II) {\displaystyle ={\frac {\ln({\textrm {GNIpc}})-\ln(100)}{\ln(75,000)-\ln(100)}}}

-
- II is 1 when GNI per capita is $75,000 and 0 when GNI per capita is $100.
Finally, the HDI is the geometric mean of the previous three normalized indices:
{\displaystyle {\textrm {HDI}}={\sqrt{{\textrm {LEI}}\cdot {\textrm {EI}}\cdot {\textrm {II}}}}.}

LE: Life expectancy at birth
MYS: Mean years of schooling (i.e. years that a person aged 25 or older has spent in formal education)
EYS: Expected years of schooling (i.e. total expected years of schooling for children under 18 years of age)
GNIpc: Gross national income at purchasing power parity per capita
Old method (HDI before 2010)
The HDI combined three dimensions last used in its 2009 report:
- Life expectancy at birth, as an index of population health and longevity to HDI
- Knowledge and education, as measured by the adult literacy rate (with two-thirds weighting) and the combined primary, secondary, and tertiary gross enrollment ratio (with one-third weighting).
- Standard of living, as indicated by the natural logarithm of gross domestic product per capita at purchasing power parity.

HDI trends between 1975 and 2004
|
OECD
Europe (not in the OECD), and CIS
Latin America and the Caribbean
East Asia
|
Arab League
South Asia
Sub-Saharan Africa
|
This methodology was used by the UNDP until their 2011 report.
The formula defining the HDI is promulgated by the United Nations Development Programme (UNDP). In general, to transform a raw variable, say {\displaystyle x}, into a unit-free index between 0 and 1 (which allows different indices to be added together), the following formula is used:

- {\displaystyle x{\text{ index}}={\frac {x-a}{b-a}}}

where {\displaystyle a} and {\displaystyle b} are the lowest and highest values the variable {\displaystyle x} can attain, respectively.


The Human Development Index (HDI) then represents the uniformly weighted sum with 1⁄3 contributed by each of the following factor indices:
- Life Expectancy Index = {\displaystyle {\frac {LE-25}{85-25}}}
- Education Index = {\displaystyle {\frac {2}{3}}\times ALI+{\frac {1}{3}}\times GEI}
- Adult Literacy Index (ALI) = {\displaystyle {\frac {ALR-0}{100-0}}}
- Gross Enrollment Index (GEI) = {\displaystyle {\frac {CGER-0}{100-0}}}
- GDP = {\displaystyle {\frac {\log \left(GDPpc\right)-\log \left(100\right)}{\log \left(40000\right)-\log \left(100\right)}}}


2019 Human Development Index (2020 report)
The Human Development Report 2020 by the United Nations Development Programme was released on 15 December 2020, and calculates HDI values based on data collected in 2019. Below is the list of countries or territories with very high human development:
 = increase.
 = steady.
 = decrease.
| Rank | Country or Territory | HDI | ||
|---|---|---|---|---|
| 2019 data (2020 report) | Change over 5 years (2014) | 2019 data (2020 report) | Average annual HDI growth (2010-2019) | |
| 1 | 0.957 | |||
| 2 | 0.955 | |||
| 2 | 0.955 | |||
| 4 | 0.949 | |||
| 4 | 0.949 | |||
| 6 | 0.947 | |||
| 7 | 0.945 | |||
| 8 | 0.944 | |||
| 8 | 0.944 | |||
| 10 | 0.940 | |||
| 11 | 0.938 | |||
| 11 | 0.938 | |||
| 13 | 0.932 | |||
| 14 | 0.931 | |||
| 14 | 0.931 | |||
| 16 | 0.929 | |||
| 17 | 0.926 | |||
| 18 | 0.922 | |||
| 19 | 0.919 | |||
| 19 | 0.919 | |||
| 19 | 0.919 | |||
| 22 | 0.917 | |||
| 23 | 0.916 | |||
| 23 | 0.916 | |||
| 25 | 0.904 | |||
| 26 | 0.901 | |||
| 27 | 0.900 | |||
| 28 | 0.895 | |||
| 29 | 0.892 | |||
| 29 | 0.892 | |||
| 31 | 0.890 | |||
| 32 | 0.888 | |||
| 33 | 0.887 | |||
| 34 | 0.882 | |||
| 35 | 0.880 | |||
| 36 | 0.868 | |||
| 37 | 0.866 | |||
| 38 | 0.864 | |||
| 39 | 0.860 | |||
| 40 | 0.854 | |||
| 40 | 0.854 | |||
| 42 | 0.852 | |||
| 43 | 0.851 | |||
| 43 | 0.851 | |||
| 45 | 0.848 | |||
| 46 | 0.845 | |||
| 47 | 0.838 | |||
| 48 | 0.829 | |||
| 49 | 0.828 | |||
| 50 | 0.826 | |||
| 51 | 0.825 | |||
| 52 | 0.824 | |||
| 53 | 0.823 | |||
| 54 | 0.820 | |||
| 55 | 0.817 | |||
| 56 | 0.816 | |||
| 57 | 0.815 | |||
| 58 | 0.814 | |||
| 58 | 0.814 | |||
| 60 | 0.813 | |||
| 61 | 0.812 | |||
| 62 | 0.810 | |||
| 62 | 0.810 | |||
| 64 | 0.806 | |||
| 64 | 0.806 | |||
| 66 | 0.804 | |||
Inequality-adjusted HDI (2020 report)
The Inequality-adjusted Human Development Index (IHDI) “equals the HDI when there is no inequality across people but is less than the HDI as inequality rises. In this sense, the IHDI is the actual level of human development (accounting for this inequality), while the HDI can be viewed as an index of ‘potential’ human development (or the maximum level of HDI) that could be achieved if there was no inequality. The ‘loss’ in potential human development due to inequality is given by the difference between the HDI and the IHDI and can be expressed as a percentage.” Below is the list of countries or territories with very high and high human development:
| Rank | Country | 2019 estimates (2020 report) | |||
|---|---|---|---|---|---|
| IHDI | HDI | Overall loss (%) | Growth since 2010 | ||
| 1 | 0.899 | 0.957 | 6.1 | ||
| 2 | 0.894 | 0.949 | 5.8 | ||
| 3 | 0.889 | 0.955 | 6.9 | ||
| 4 | 0.888 | 0.938 | 5.3 | ||
| 5 | 0.885 | 0.955 | 7.3 | ||
| 6 | 0.883 | 0.940 | 6.1 | ||
| 7 | 0.882 | 0.945 | 6.7 | ||
| 8 | 0.878 | 0.944 | 7.0 | ||
| 9 | 0.875 | 0.917 | 4.6 | ||
| 10 | 0.869 | 0.947 | 8.2 | ||
| 11 | 0.867 | 0.944 | 8.2 | ||
| 12 | 0.860 | 0.900 | 4.4 | ||
| 13 | 0.859 | 0.931 | 7.7 | ||
| 14 | 0.859 | 0.931 | 7.7 | NA | |
| 15 | 0.857 | 0.922 | 7.0 | ||
| 16 | 0.856 | 0.932 | 8.2 | ||
| 17 | 0.848 | 0.929 | 8.7 | ||
| 18 | 0.843 | 0.919 | 8.3 | ||
| 19 | 0.829 | 0.882 | 7.1 | ||
| 20 | 0.826 | 0.916 | 9.8 | ||
| 21 | 0.824 | 0.949 | 13.2 | NA | |
| 22 | 0.823 | 0.895 | 8.0 | ||
| 23 | 0.820 | 0.901 | 9.0 | ||
| 24 | 0.815 | 0.916 | 11.0 | ||
| 25 | 0.814 | 0.919 | 11.4 | ||
| 26 | 0.813 | 0.938 | 13.3 | NA | |
| 26 | 0.813 | 0.880 | 7.6 | ||
| 28 | 0.808 | 0.926 | 12.7 | ||
| 29 | 0.807 | 0.860 | 6.2 | ||
| 30 | 0.805 | 0.887 | 9.2 | ||
| 31 | 0.791 | 0.854 | 7.4 | ||
| 31 | 0.791 | 0.882 | 10.3 | ||
| 31 | 0.791 | 0.888 | 10.9 | ||
| 34 | 0.783 | 0.892 | 12.2 | ||
| 34 | 0.783 | 0.866 | 9.6 | ||
| 34 | 0.783 | 0.851 | 8.0 | ||
| 34 | 0.783 | 0.904 | 13.4 | ||
| 38 | 0.771 | 0.823 | 6.3 | ||
| 39 | 0.766 | 0.825 | 7.2 | ||
| 40 | 0.761 | 0.850 | 12.7 | ||
| 41 | 0.749 | 0.829 | 9.7 | ||
| 42 | 0.740 | 0.824 | 10.2 | ||
| 43 | 0.730 | 0.828 | 11.8 | ||
| 44 | 0.729 | 0.845 | 13.7 | ||
| 45 | 0.728 | 0.779 | 6.4 | ||
| 46 | 0.721 | 0.816 | 11.6 | ||
| 47 | 0.716 | 0.812 | 11.8 | ||
| 48 | 0.712 | 0.817 | 12.7 | ||
| 49 | 0.709 | 0.851 | 16.7 | ||
| 50 | 0.708 | 0.795 | 10.9 | ||
| 51 | 0.706 | 0.813 | 13.2 | NA | |
| 52 | 0.705 | 0.806 | 12.5 | ||
Past top countries
The list below displays the top-ranked country from each year of the Human Development Index. Norway has been ranked the highest sixteen times, Canada eight times, and Japanand Iceland twice.
In each original HDI
The year represents the time period from which the statistics for the index were derived. In parentheses is the year when the report was published.
- 2019 (2020):
 Norway
 - 2018 (2019): Norway
- 2017 (2018): Norway
- 2015 (2016): Norway
- 2014 (2015): Norway
- 2013 (2014): Norway
- 2012 (2013): Norway
- 2011 (2011): Norway
- 2010 (2010): Norway
- 2007 (2009): Norway
- 2006 (2008):
 Iceland
 - 2005 (2007): Iceland
- 2004 (2006): Norway
- 2003 (2005): Norway
- 2002 (2004): Norway
- 2001 (2003): Norway
- 2000 (2002): Norway
- 1999 (2001): Norway
- 1998 (2000):
 Canada
 - 1997 (1999): Canada
- 1995 (1998): Canada
- 1994 (1997): Canada
- 1993 (1996): Canada
- 1992 (1995): Canada
- ???? (1994): Canada
- ???? (1993):
 Japan
Japan - 1990 (1992): Canada
- 1990 (1991): Japan
Geographical coverage
The HDI has extended its geographical coverage: David Hastings, of the United Nations Economic and Social Commission for Asia and the Pacific, published a report geographically extending the HDI to 230+ economies, whereas the UNDP HDI for 2009 enumerates 182 economies and coverage for the 2010 HDI dropped to 169 countries.
Country/region specific HDI lists
- African countries
- Argentine provinces
- Australian states
- Bolivian departments
- Brazilian states
- Canadian provinces and territories
- Chilean regions
- Chinese administrative divisions
- Colombian Departaments
- Ethiopian regions
- European countries
- German states
- Indian states
- Tamil Nadu districts
- Indonesian provinces
- Iranian provinces
- Iraqi governorates
- Italian regions
- Japanese prefectures
- Latin American countries
- Mexican states
- New Zealand regions
- Nigerian States
- Pakistani administrative units
- Philippine provinces
- Palestinian regions
- Polish voivodeships
- Russian federal subjects
- South African provinces
- Spanish communities
- Swiss regions
- UK countries and regions of England
- U.S. states (American Human Development Report (AHDR))
- Venezuelan states
Criticism

HDI vs. ecological footprint
The Human Development Index has been criticized on a number of grounds, including alleged lack of consideration of technological development or contributions to the human civilization, focusing exclusively on national performance and ranking, lack of attention to development from a global perspective, measurement error of the underlying statistics, and on the UNDP’s changes in formula which can lead to severe misclassification in the categorisation of “low”, “medium”, “high” or “very high” human development countries.
Sources of data error
Economists Hendrik Wolff, Howard Chong and Maximilian Auffhammer discuss the HDI from the perspective of data error in the underlying health, education and income statistics used to construct the HDI. They identified three sources of data error which are due to (i) data updating, (ii) formula revisions and (iii) thresholds to classify a country’s development status and conclude that 11%, 21% and 34% of all countries can be interpreted as currently misclassified in the development bins due to the three sources of data error, respectively. The authors suggest that the United Nations should discontinue the practice of classifying countries into development bins because: the cut-off values seem arbitrary, can provide incentives for strategic behavior in reporting official statistics, and have the potential to misguide politicians, investors, charity donors and the public who use the HDI at large.
In 2010, the UNDP reacted to the criticism and updated the thresholds to classify nations as low, medium, and high human development countries. In a comment to The Economist in early January 2011, the Human Development Report Office responded to a 6 January 2011 article in the magazine which discusses the Wolff et al. paper. The Human Development Report Office states that they undertook a systematic revision of the methods used for the calculation of the HDI, and that the new methodology directly addresses the critique by Wolff et al. in that it generates a system for continuously updating the human-development categories whenever formula or data revisions take place.
In 2013, Salvatore Monni and Alessandro Spaventa emphasized that in the debate of GDP versus HDI, it is often forgotten that these are both external indicators that prioritize different benchmarks upon which the quantification of societal welfare can be predicated. The larger question is whether it is possible to shift the focus of policy from a battle between competing paradigms to a mechanism for eliciting information on well-being directly from the population.