
Revenue Divisions are the administrative divisions in districts of some of the Indian states. These divisions are sub-divided into mandals. There are 71 revenue divisions in Telangana. Revenue Divisional Officer (RDO) is the head of the division.
Contents
1List of revenue divisions
2See also
3References
4External links
List of revenue divisions
There are a total of 70 revenue divisions in the state. The below table details the revenue divisions with respect to their districts.
District No. of Divisions
Adilabad 2
Bhadradri Kothagudem 2
Hanmakonda 2
Hyderabad 2
Jagtial 2
Jangaon 2
Jayashankar Bhupalpalle 2
Jogulamba Gadwal 1
Kamareddy 3
Karimnagar 2
Komaram Bheem 2
Khammam 2
Mahabubnagar 1
Mahabubabad 2
Medchal 2
Mulugu 1
Medak 3
Mancherial 2
Narayanapet 1
Nalgonda 3
Nagarkurnool 4
Nizamabad 3
Nirmal 2
Peddapalli 2
Rajanna Sircilla 1
Ranga Reddy 5
Siddipet 3
Sangareddy 4
Suryapet 2
Vikarabad 2
Wanaparthy 1
Warangal 2
Yadadri Bhuvanagiri 2
Total 72
In the year 1985, following the introduction of the mandal system, the district has been divided into 46 mandals, under four Revenue Divisions – Khammam, Kothagudem, Paloncha and Bhadrachalam.
On 2 June 2014, Khammam together with nine other districts became the new state of Telangana, which was separated from Andhra Pradesh. On 11 July 2014, the Lok Sabha approved a bill transferring seven mandals of Khammam district (Kukunoor, Velairpadu, Bhurgampadu, Chintoor, Kunavaram, Vararamachandrapuram and Bhadrachalam) back to Andhra Pradesh, in order to facilitate the Polavaram Irrigation project.
Geography
Khammam district occupies an area of 4,453.00 square kilometres (1,719.31 sq mi).
Demographics
As of 2011 Census of India, the district has a population of 1,389,566.
Administrative divisions
The district has two revenue divisions of Kallur and Khammam. These are sub-divided into 21 mandals. Rv Karnan is the present collector of the district.
Mandals
The mandals of Chinturu, Kunavaram, Nellipaka and Vararamachandrapuram were added to East Godavari district based on Polavaram ordinance.
The list of 21 mandals in Khammam district under 2 revenue divisions are listed in the following table:
| S.No. | Khammam Division | S.No. | Kalluru Division |
|---|---|---|---|
| 1 | Bonakal | 16 | Kalluru |
| 2 | Chinthakani | 17 | Thallada |
| 3 | Raghunathapalem (New) | 18 | Enkuru |
| 4 | Khammam (rural) | 19 | Penuballi |
| 5 | Khammam | 20 | Sathupally |
| 6 | Konijerla | 21 | Vemsoor |
| 7 | Kusumanchi | ||
| 8 | Madhira | ||
| 9 | Mudigonda | ||
| 10 | Nelakondapalli | ||
| 11 | Kamepalli | ||
| 12 | Singareni | ||
| 13 | Thirumalayapalem | ||
| 14 | Wyra | ||
| 15 | Yerrupalem |
Economy

Coal Handling Ropeway near Pamulapalli village (supply of coal from Manugur open cast mine to Aswapuram Heavy Water Plant)
In 2006 the Indian government named Khammam one of the country’s 250 most backward districts (out of a total of 640). It is one of the districts in Telangana currently receiving funds from the Backward Regions Grant Fund Programme (BRGF).
Notable personalities
 |
This section includes a list of references, related reading or external links, but its sources remain unclear because it lacks inline citations. (February 2020)
|
- The former Chief Minister of Andhra Pradesh(United), Jalagam Vengala Rao is from Khammam District. He served as 5th chief minister during 1973–78.
- Thummala Nageshwar Rao, minister for Roads and buildings, women and child welfare in Telangana State Government is from this region. He also occupied several ministerial portfolios in United Andhra Pradesh.
- Renuka Choudary, is an Indian politician and a member of the Indian National Congress, She has also served as the Union minister of State (Independent Charge) for Ministry of Women and Child Development and Tourism in UnitedAndhra Pradesh in the Government of India.
- Nama Nageswara Rao served as Member of Parliament for 16th Lok Sabha of India. He is a businessman and owner of Madhucon Projects.At present 2020 he is the minister of khammam district(TRS Party).
- Babu Mohan, notable actor and comedian in the Telugu film industry. He also served as Social Welfare Minister in TDP Government.
- Vandemataram Srinivas is a South Indian music director, actor and singer.
- K.Dasaradh is a Telugu film Writer, Director. He is well known for his movies Santosham (2002 film) and Mr. Perfect (film).
- Srinivasa Reddy, notable actor and comedian in the Telugu film industry.Ninth1989-91Jalagam Vengala RaoIndian National Congress
Tenth1991-96P.V. Rangaiah Naidu IPS retiredIndian National Congress
Eleventh1996-98Veerabhadram TammineniCommunist Party of India (Marxist)
Twelfth1998-99Nadendla Bhaskara RaoIndian National Congress
Thirteenth1999-04Renuka ChowdharyIndian National Congress
Fourteenth2004-09Renuka ChowdharyIndian National Congress
Fifteenth2009-14Nama Nageswara RaoTelugu Desam Party
Sixteenth2014-19Ponguleti Srinivas ReddyYuvajana Sramika Rythu Congress Party
Seventeenth2019-IncumbentNama Nageswara RaoTelangana Rashtra SamithiElection results
General Election, 2019
2019 Indian general elections: Khammam Party Candidate Votes % ±% TRS Nama Nageswara Rao 5,67,459 49.78 INC Renuka Chowdhury 3,99,397 35.04 CPI (M) Boda Venkat 57,102 5.01 BJP Devaki Vasudeva Rao 20,488 1.80 Jana Sena Narala Satyanarayana 19,315 1.69 NOTA None of the Above 15,832 1.39 Majority 1,68,062 14.74 Turnout 11,39,848 75.30 TRS gain from YSRCP Swing General Election, 2014
2014 Indian general elections: Khammam Party Candidate Votes % ±% YSRCP Ponguleti Srinivasa Reddy 4,21,957 35.67 TDP Nama Nageswara Rao 4,09,983 34.66 CPI Kankanala Narayana 1,87,653 15.86 TRS Budan Baig Shaik 89,063 7.53 Majority 11,974 Turnout 11,82,897 82.13 +0.05 YSRCP gain from TDP Swing General Election, 2009
2009 Indian general elections: Khammam Party Candidate Votes % ±% TDP Nama Nageswara Rao 4,69,368 45.39 INC Renuka Chowdary 3,44,920 33.36 PRP Jalagam Hemamalini 1,87,653 12.68 Majority 1,24,448 Turnout 10,34,009 82.08 +3.59 TDP gain from INC Swing General Election, 2004
General Election, 2004: Khammam Party Candidate Votes % ±% INC Renuka Chowdary 5,18,047 50.63 TDP Nama Nageswara Rao 4,09,159 39.99 Majority 1,08,888 Turnout 10,23,177 78.79 +4.02 INC hold Swing General Election, 1999
General Election, 1999: Khammam Party Candidate Votes % ±% INC Renuka Chowdary 3,28,596 34.7% TDP Baby Swarna Kumari 3,20,198 33.8 CPI (M) Guguloth Dharma 1,84,422 19.5 Majority 8,398 0.9 Turnout 9,48,088 77.2 INC hold Swing General Election, 1998
General Election, 1998: Khammam Party Candidate Votes % ±% INC Nadendla Bhaskara Rao 3,63,747 39.7 CPI (M) Tammineni Veerabhadram 3,52,083 38.4 BJP Ravindra Naik Dharavath 1,17,926 12.9 Majority 11,664 1.3 Turnout 9,17,369 74.7 INC gain from CPI (M) Swing General Election, 1996
General Election, 1996: Khammam Party Candidate Votes % ±% CPI (M) Tammineni Veerabhadram 3,74,675 41.8 INC P.V. Rangaiah Naidu IPS retired 3,11,384 34.8 NTRTDP(LP) Nageswara Rao Koneru 75,072 8.4 Majority 63,291 7.1 Turnout 8,95,441 72.6 CPI (M) gain from INC Swing General Election, 1991
General Election, 1991: Khammam Party Candidate Votes % ±% INC P.V. Rangaiah Naidu IPS retired 3,16,186 43.2% CPI (M) Tammineni Veerabhadram 3,10,268 42.3% Independent Gaddam Venkatramayya 45,999 6.3% Majority 5,918 0.8% Turnout 7,32,650 70.2% INC hold Swing General Election, 1962
- T. Lakshikantamma (Congress) : 163,806 votes
- T B Vittal Rao (CPI) : 1,51,7460
Mean monthly sunshine hours54.475.9111.9169.6190.6190.0199.0190.7149.6103.065.848.91,549.4Source 1: Met OfficeSource 2: KNMIDemography
Historical population Year Pop. ±% 1801 6,342 — 1851 26,630 +319.9% 1861 48,965 +83.9% 1871 71,301 +45.6% 1881 93,637 +31.3% 1891 142,114 +51.8% 1901 172,629 +21.5% 1911 209,804 +21.5% 1921 227,753 +8.6% 1931 247,270 +8.6% 1941 257,112 +4.0% 1951 267,356 +4.0% 1961 278,552 +4.2% 1971 290,227 +4.2% 1981 274,500 −5.4% 1991 272,557 −0.7% 2001 292,150 +7.2% 2011 346,100 +18.5% 2017 362,756 +4.8% Source: Vision of Britain except 2011, which is the 2011 census data from the Office for National Statistics. Historical populations are calculated with the modern boundaries After a period of decline in the 1970s and 1980s, Cardiff’s population is growing again. It reached 346,100 in the 2011 census, compared to a 2001 census figure of 305,353. Between mid−2007 and mid–2008, Cardiff was the fastest-growing local authority in Wales, with growth of 1.2%. According to 2001 census data, Cardiff was the 21st largest urban area. The Cardiff Larger Urban Zone (a Eurostat definition including the Vale of Glamorgan and a number of local authorities in the Valleys) has 841,600 people, the 10th largest LUZ in the UK. The Cardiff and South Wales Valleys metropolitan area has a population of nearly 1.1 million.
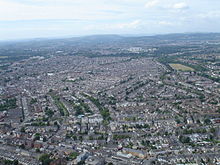
Residential areas of northern Cardiff
Official census estimates of the city’s total population have been disputed. The city council published two articles arguing that the 2001 census seriously under-reported the population of Cardiff, and in particular the ethnic minority population of some inner city areas.
The Welsh Government’s official mid-year estimate of the population of the Cardiff local authority area in 2019 was 366,903. At the 2011, census the official population of the Cardiff Built Up Area (BUA) was put at 447,287. The BUA is not contiguous with the local authority boundary and aggregates data at a lower level; for Cardiff this includes the urban part of Cardiff, Penarth/Dinas Powys, Caerphilly and Pontypridd.
Cardiff has an ethnically diverse population due to past trading connections, post-war immigration and large numbers of foreign students who attend university in the city. The ethnic make-up of Cardiff’s population at the 2011 census was: 84.7% White, 1.6% mixed White and Black African/Caribbean, 0.7% mixed White and Asian, 0.6% mixed other, 8.1% Asian, 2.4% Black, 1.4% Arab and 0.6% other ethnic groups. This means almost 53,000 people from a non-white ethnic group reside in the city. This diversity, especially that of the city’s long-established African and Arab communities, has been celebrated in cultural exhibitions and events, along with a number of books published on this subject.
Health
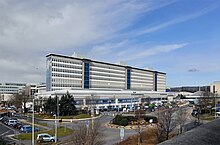
University Hospital of Wales
There are seven NHS hospitals in the city, the largest being the University Hospital of Wales, which is the third largest hospital in the UK and deals with most accidents and emergencies. The University Dental Hospital, which provides emergency treatment, is also located on this site. Llandough Hospital is located in the south of the city.
St. David’s Hospital, the city’s newest hospital, built behind the former building, is located in Canton and provides services for the elderly and children. Cardiff Royal Infirmary is on Newport Road, near the city centre. The majority of this hospital was closed in 1999, but the west wing remained open for clinic services, genitourinary medicine and rehabilitation treatment. Rookwood Hospital and the Velindre Cancer Centre are also located within Cardiff. They are administered by the Cardiff and Vale University Health Board, with the exception of Velindre, which is run by a separate trust. Spire Healthcare, a private hospital, is in Pontprennau.
Language

Bilingual signs are commonplace in Cardiff.
Cardiff has a chequered linguistic history with Welsh, English, Latin, Norse and Norman French preponderant at different times. Welsh was the majority language in Cardiff from the 13th century until the city’s explosive growth in the Victorian era. As late as 1850, five of the 12 Anglican churches within the current city boundaries conducted their services exclusively in Welsh, while only two worshipped exclusively in English. By 1891, the percentage of Welsh speakers had fallen to 27.9% and only Lisvane, Llanedeyrn and Creigiau remained as majority Welsh-speaking communities. The Welsh language became grouped around a small cluster of chapels and churches, the most notable of which is Tabernacl in the city centre, one of four UK churches chosen to hold official services to commemorate the new millennium.
The city’s first Welsh-language school (Ysgol Gymraeg Bryntaf) was established in the 1950s. Welsh has since regained ground. Aided by Welsh-medium education and migration from other parts of Wales, there are now many more Welsh speakers: their numbers doubled between the 1991 and 2011 censuses, from 18,071 (6.6%) to 36,735 (11.1%) residents aged three years and above. The LSOA (Lower Layer Super Output Area) with the highest percentage of Welsh speakers in the city centre is found in Canton, at 25.5%. The LSOA with the highest percentage of Welsh speakers in the whole of Cardiff is Whitchurch, at 26%.
Cardiff City Council adopted a five-year Welsh-language strategy in 2017, aimed at increasing the number of Welsh speakers (aged 3+) in Cardiff by 15.9%, from 36,735 in 2011 to 42,584 residents by the 2021 Census. The ONS estimated that in December 2020, 89,900 (24.8%) of Cardiff’s population could speak Welsh.
In addition to English and Welsh, the diversity of Cardiff’s population (including foreign students) means that many other languages are spoken. One study has found that Cardiff has speakers of at least 94 languages, with Somali, Urdu, Bengali and Arabic being the most commonly spoken foreign ones.
The modern Cardiff accent is distinct from that of nearby South Wales Valleys. It is marked primarily by:
- Substitution of ⟨iə⟩ by ⟨jøː⟩
- here pronounced as in the broader form
- The vowel of start may be realised as or even , so that Cardiff is pronounced .
Language schools
Due to its diversity and large student population, more people now come to the city to learn English. Foreign students from Arab states and other European countries are a common sight on the streets of Cardiff. The British Council has an office in the city centre and there are six accredited schools in the area.
Religion
Cardiff’s cathedrals