
Maricopa County is located in the south-central part of the U.S. state of Arizona. As of the 2020 census, the county’s population was 4,420,568, making it the state’s most populous county, and the fourth-most populous in the United States. It contains about 62% of Arizona’s population, making Arizona one of the most centralized states in the nation. The county seat is Phoenix, the state capital and fifth-most populous city in the United States.
Maricopa County is the central county of the Phoenix-Mesa-Chandler, AZ Metropolitan Statistical Area. The Office of Management and Budget renamed the metropolitan area in September 2018. Previously, it was the Phoenix-Mesa-Glendale metropolitan area, and in 2000, that was changed to Phoenix-Mesa-Scottsdale.
Maricopa County was named after the Maricopa Native Americans. Five Native American Reservations are located in the county. The largest are the Salt River Pima-Maricopa Indian Community (east of Scottsdale) and the Gila River Indian Community (south of Chandler).
Geography
According to the U.S. Census Bureau, the county has a total area of 9,224 sq mi (23,890 km2), of which 24 sq mi (62 km2) (0.3%) are covered by water. Maricopa County is one of the largest counties in the United States by area, with a land area greater than that of four other US states. From west to east, it stretches 132 miles (212 km), and 103 miles (166 km) from north to south. It is by far Arizona’s most populous county, encompassing well over half of the state’s residents. It is the largest county in the United States to have a capital city.
Adjacent counties
- La Paz County – west
- Yuma County – west
- Pima County – south
- Pinal County – southeast
- Gila County – east
- Yavapai County – north
National protected areas
- Sonoran Desert National Monument (part)
- Tonto National Forest (part)
Demographics

Median Household Income in 2015 across metro Phoenix; the darker the green, the higher the income
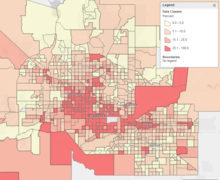
Percent of people living in poverty across metro Phoenix in 2016; the darker the red, the higher the concentration of poverty
| Historical population | |||
|---|---|---|---|
| Census | Pop. | %± | |
| 1880 | 5,689 | — | |
| 1890 | 10,986 | 93.1% | |
| 1900 | 20,457 | 86.2% | |
| 1910 | 34,488 | 68.6% | |
| 1920 | 89,576 | 159.7% | |
| 1930 | 150,970 | 68.5% | |
| 1940 | 186,193 | 23.3% | |
| 1950 | 331,770 | 78.2% | |
| 1960 | 663,510 | 100.0% | |
| 1970 | 971,228 | 46.4% | |
| 1980 | 1,509,175 | 55.4% | |
| 1990 | 2,122,101 | 40.6% | |
| 2000 | 3,072,149 | 44.8% | |
| 2010 | 3,817,117 | 24.2% | |
| 2020 | 4,420,568 | 15.8% | |
| U.S. Decennial Census 1790–1960 1900–1990 1990–2000 2010–2018 |
|||
Racial and ethnic composition since 1960
| hideRacial composition | 2020 | 2010 | 2000 | 1990 | 1980 | 1970 | 1960 |
|---|---|---|---|---|---|---|---|
| White | 59.8% | 73.0% | 77.3% | 84.7% | 86.6% | 94.8% | 94.5% |
| —Non-Hispanic | 53.3% | 58.7% | 66.2% | 77.1% | 81.1% | – | – |
| Black or African American | 5.9% | 5.0% | 3.7% | 3.4% | 3.1% | 3.3% | 3.7% |
| Hispanic or Latino (of any race) | 30.6% | 29.6% | 24.8% | 16.2% | 13.1% | 14.5% | – |
| Asian | 4.6% | 3.5% | 2.1% | 1.7% | – | – | 0.3% |
| Native American | 2.3% | 2.1% | 1.8% | 1.7% | – | – | 1.2% |
| Pacific Islander | 0.2% | 0.2% | 0.1% | – | – | – | – |
| Mixed Race | 13.6% | 2.4% | 2.9% | – | – | – | – |
2000 census
As of the census of 2000, 3,072,149 people, 1,132,886 households, and 763,565 families were living in the county. The population density was 334 people/sq mi (129/km2). The 1,250,231 housing units averaged of 136/sq mi (52/km2). The racial makeup of the county was 77.4% White, 3.7% African American, 1.9% Native American, 2.2% Asian, 12.0% from other races, and 2.9% from two or more races. About 29.5% of the population were Hispanics or Latinos of any race. About 19.1% reported speaking Spanish at home.
Of the 1,132,886 households, 33.0% had children under 18 living with them, 51.6% were married couples living together, 10.7% had a female householder with no husband present, and 32.6% were not families. About 24.5% of all households were made up of individuals, and 7.9% had someone living alone who was 65 or older. The average household size was 2.67, and the average family size was 3.21.
The age distribution in the county was 27.0% under 18, 10.2% from 18 to 24, 31.4% from 25 to 44, 19.80% from 45 to 64, and 11.7% who were 65 or older. The median age was 33 years. For every 100 females, there were 100.10 males. For every 100 females age 18 and over, there were 98.10 males.
The median income for a household in the county was $45,358, and for a family was $51,827. Males had a median income of $36,858 versus $28,703 for females. The per capita income for the county was $22,251. About 8.0% of families and 11.7% of the population were below the poverty line, including 15.4% of those under age 18 and 7.4% of those age 65 or over.
2010 census
As of the 2010 census, 3,817,117 people, 1,411,583 households, and 932,814 families were living in the county. The population density was 414.9/sq mi (160.2/km2). The 1,639,279 housing units averaged 178.2/sq mi (68.8/km2). The racial makeup of the county was 73.0% white (58.7% non-Hispanic white), 5.0% African American, 3.5% Asian, 2.1% American Indian, 0.2% Pacific islander, 12.8% from other races, and 3.5% from two or more races. Those of Hispanic or Latino origin made up 29.6% of the population. The largest ancestry groups were:
- 25.6% Mexican
- 16.2% German
- 10.6% Irish
- 9.7% English
- 5.2% American
- 5.1% Italian
- 2.8% Polish
- 2.8% French
- 2.0% Scottish
- 1.9% Norwegian
- 1.8% Swedish
- 1.6% Dutch
- 1.5% Scotch-Irish
- 1.0% Russian
Of the 1,411,583 households, 35.1% had children under 18 living with them, 47.8% were married couples living together, 12.4% had a female householder with no husband present, 33.9% were not families, and 25.9% of all households were made up of individuals. The average household size was 2.67 and the average family size was 3.25. The median age was 34.6 years.
The median income for a household in the county was $55,054 and the median income for a family was $65,438. Males had a median income of $45,799 versus $37,601 for females. The per capita income for the county was $27,816. About 10.0% of families and 13.9% of the population were below the poverty line, including 19.8% of those under age 18 and 7.0% of those age 65 or over.
According to data provided by the United States Census Bureau in October 2015 and collected from 2009 to 2013, 73.72% of the population aged five years and over spoke only English at home, while 20.32% spoke Spanish, 0.56% spoke Chinese, 0.47% Vietnamese, 0.41% Tagalog, 0.37% Arabic, 0.36% German, 0.30% French, 0.25% Navajo, 0.21% Korean, 0.20% Hindi, 0.15% Italian, 0.14% Persian, 0.13% Russian, 0.13% Serbo-Croatian, 0.12% Telugu, 0.12% Polish, 0.11% Syriac, 0.11% Japanese, 0.11% spoke Romanian, and 0.10% spoke other Native North American languages at home.
Religion
In 2010 statistics, the largest religious group in Maricopa County was the Diocese of Phoenix, with 519,950 Catholics worshipping at 99 parishes, followed by 242,732 LDS Mormons with 503 congregations, 213,640 non-denominational adherents with 309 congregations, 93,252 AG Pentecostals with 120 congregations, 73,207 SBC Baptists with 149 congregations, 35,804 Christian churches and churches of Christ Christians with 29 congregations, 30,014 ELCA Lutherans with 47 congregations, 28,634 UMC Methodists with 55 congregations, 18,408 LCMS Lutherans with 34 congregations, and 15,001 PC-USA Presbyterians with 42 congregations. Altogether, 39.1% of the population was claimed as members by religious congregations, although members of historically African-American denominations were underrepresented due to incomplete information. In 2014, the county had 1,177 religious organizations, the fifth most out of all US counties.
Government, policing, and politics
Government
The governing body of Maricopa County is its board of supervisors. The Maricopa County Board of Supervisors consists of five members chosen by popular vote within their own districts. Currently, the board consists of four Republicans and one Democrat. Each member serves a four-year term, with no term limits.
Maricopa County sheriff
The Maricopa County Sheriff’s Office provides court protection, administers the county jail, and patrols the unincorporated areas of the county plus incorporated towns by contract.
Politics
For much of the time after World War II, Maricopa County was one of the more conservative urban counties in the United States. While the city of Phoenix has been evenly split between the two major parties, most of the rest of the county was strongly Republican. Until 2020, every Republican presidential candidate since 1952 had carried Maricopa County. This includes the 1964 presidential run of native son Barry Goldwater, who would not have carried his own state had it not been for a 21,000-vote margin in Maricopa County. Until 2020, it was the largest county in the country to vote Republican. From 1968 to 2016, Democrats held the margin within single digits only three times–in 1992, 1996, and 2016. In 2020, Joe Biden became the first Democrat in 72 years to win the county, which flipped Arizona to the Democratic column for the first time since 1996 and only the second time since 1948. Furthermore, Biden became the first presidential candidate to win more than one million votes in the county. This makes Maricopa County the third county in American history to cast more than one million votes for a presidential candidate. The county is also a statewide bellwether, voting for the statewide winning candidate in all elections except 1996.
Despite its consistent Republican allegiance since 1952, its fast-growing Hispanic population and influx of conservative retirees and Mormons, which were traditionally conservative voting blocs but were increasingly skeptical of President Donald Trump, signaled that it was a crucial bellwether in the 2020 election.
| Voter Registration as of July 2021 | |||||
|---|---|---|---|---|---|
| Party | Number of voters | Percentage | |||
| Republican | 908,613 | 34.59% | |||
| Other/Independents | 877,472 | 33.41% | |||
| Democratic | 816,385 | 31.08% | |||
| Libertarian Party | 24,254 | 0.92% | |||
| Total | 2,626,724 | 100% | |||
Despite its political leanings at the time, Maricopa County voted against Proposition 107 in the 2006 election. This referendum, designed to ban gay marriage and restrict domestic partner benefits, was rejected by a 51.6–48.4% margin within the county, and statewide by a similar margin. Two years later, however, a majority of county residents voted to pass a successful state constitutional amendment banning same-sex marriage. The amendment was later invalidated by the Supreme Court’s 2015 ruling in Obergefell v. Hodges, which declared that same-sex marriage is a fundamental right in the United States.
Unlike cities and towns in Arizona, counties are politically and legally subordinate to the state and do not have charters of their own. The county Board of Supervisors acts under powers delegated by state law, mainly related to minor ordinances and revenue collection. With few exceptions, these powers are narrowly construed. The state legislature devotes considerable time to local matters, with legislative approval required for many routine local issues. The chairperson of the board presides for a one-year term, selected by the board members during a public hearing.
The County Sheriff, County Attorney, County Assessor, County Treasurer, Superintendent of Schools, County Recorder, Constables, Justices of the Peace, and Clerk of the Superior Court are elected by the people. Retention of Superior Court Judges is also determined by popular vote.
The county’s dominant political figure for over two decades (from 1993 to 2017) was Sheriff Joe Arpaio, who called himself “America’s Toughest Sheriff” and gained national notoriety for his flamboyant and often controversial practices and policies.
Maricopa County is home to 62 percent of the state’s population and therefore dominates Arizona’s politics. For example, in the 2018 Senate election, Democrat Kyrsten Sinema carried the county en route to becoming the first Democrat to win a Senate seat in Arizona since 1988. She won the county by over 60,000 votes, more than enough for the victory; she won statewide by 55,900 votes. All but one of the state’s nine congressional districts include part of the county, and five of the districts have their population center located there. Most of the state’s prominent elected officials live in the county. Further underlining Maricopa County’s political dominance, Biden’s margin of 45,109 votes was more than enough to carry the state; he only won Arizona by 10,457 votes.
Elected officials
United States Congress
| District | Name | Party | First elected | Area(s) represented | |
|---|---|---|---|---|---|
| United States Senate | |||||
| Class I Senator | Kyrsten Sinema | Democratic | 2018 | At Large | |
| Class III Senator | Mark Kelly | Democratic | 2020 | ||
| United States House of Representatives | |||||
| 1 | Tom O’Halleran | Democratic | 2016 | Phoenix, Gila River Indian Community | |
| 3 | Raul Grijalva | Democratic | 2002 | Buckeye, Gila Bend, Avondale, Phoenix | |
| 4 | Paul Gosar | Republican | 2010 | Apache Junction, Camp Creek, Phoenix | |
| 5 | Andy Biggs | Republican | 2016 | Gilbert, Mesa, Chandler, Queen Creek | |
| 6 | David Schweikert | Republican | 2010 | Fountain Hills, Phoenix, Scottsdale, Paradise Valley | |
| 7 | Ruben Gallego | Democratic | 2014 | Glendale, Phoenix | |
| 8 | Debbie Lesko | Republican | 2018 | Glendale, Peoria, Phoenix, Surprise | |
| 9 | Greg Stanton | Democratic | 2018 | Chandler, Mesa, Tempe, Phoenix | |
- ^ Due to redistricting in 2012, many of the Representatives listed were first elected to a district other than the one they currently represent.
The 5th, 6th, 7th, 8th and 9th districts are all centered in Maricopa County. The 1st and 4th are centered in rural Arizona, while the 2nd is primarily Tucscon-based.
Board of Supervisors
Elected county officials
| Party | Office | Name | First elected | Reference | |
|---|---|---|---|---|---|
| Republican | Assessor | Eddie Cook | 2020† | ||
| Republican | Clerk of the Superior Court | Jeff Fine | 2018† | ||
| Republican | County Attorney | Allister Adel | 2020† | ||
| Republican | County Recorder | Stephen Richer | 2020 | ||
| Republican | County School Superintendent | Steve Watson | 2016 | ||
| Democratic | Sheriff | Paul Penzone | 2016 | ||
| Republican | Treasurer | John Allen | 2020 | ||
†Member was originally appointed to the office.
Education
- Maricopa County Library District operates the county libraries in Maricopa County.
- The Maricopa County School Superintendent is charged with the general conduct and supervision of the public school system in Maricopa County. The Superintendent is one of six county-wide elected officials, elected by the voters of Maricopa County every four years. Since the inception of the office, there have been thirteen Maricopa County School Superintendents. The incumbent, Steve Watson, took office January 1, 2017.
Transportation
Major highways
 Interstate 8
 Interstate 10
 Interstate 17
 U.S. Route 60
 Historic U.S. Route 80
 U.S. Route 93
 Loop 101
 Loop 202
 Loop 303
 State Route 51
 State Route 71
 State Route 74
 State Route 85
 State Route 87
 State Route 143
 State Route 347
Air
The major primary commercial airport of the county is Sky Harbor International Airport (PHX).
Other airports located in the county include:
- Phoenix-Mesa Gateway Airport in Mesa (AZA)
- Scottsdale Municipal Airport in Scottsdale (SCF)
- Deer Valley Airport in Deer Valley Village in Phoenix (DVT)
- Chandler Municipal Airport in Chandler (CHD)
- Phoenix Goodyear Airport in Goodyear (GYR)
- Glendale Municipal Airport in Glendale (GEU)
- Buckeye Municipal Airport in Buckeye (BXK)
- Falcon Field in Mesa (MSC)
- Gila Bend Municipal Airport in Gila Bend (E63)
- Wickenburg Municipal Airport in Wickenburg (E25)
Rail
In terms of freight rail, the Union Pacific Railroad and the Burlington Northern Santa Fe Railroad serve the county.
In terms of passenger rail, greater Phoenix is served by a light rail system. The county has no other passenger rail transport as Amtrak’s Sunset Limited, which served Phoenix until June 2, 1996, has its closest stop in Maricopa in neighboring Pinal County. The train connects Maricopa to Tucson, Los Angeles, and New Orleans three times a week. However it does not stop in Phoenix itself.
Communities
Cities
- Avondale
- Buckeye
- Chandler
- El Mirage
- Glendale
- Goodyear
- Litchfield Park
- Mesa
- Peoria (partly in Yavapai County)
- Phoenix (county seat)
- Scottsdale
- Surprise
- Tempe
- Tolleson
Towns
- Carefree
- Cave Creek
- Fountain Hills
- Gila Bend
- Gilbert
- Guadalupe
- Paradise Valley
- Queen Creek (partly in Pinal County)
- Wickenburg (partly in Yavapai County)
- Youngtown
Ghost towns
- Agua Caliente
- Alma
- Angel Camp
- Marinette
- Nothing
- Vulture City
Census-designated places
- Aguila
- Anthem
- Arlington
- Citrus Park
- Gila Crossing
- Kaka
- Komatke
- Maricopa Colony
- Morristown
- New River
- Rio Verde
- St. Johns
- Sun City
- Sun City West
- Sun Lakes
- Theba
- Tonopah
- Wintersburg
- Wittmann
Unincorporated communities
- Chandler Heights
- Circle City
- Co-op Village
- Desert Hills
- Fort McDowell
- Higley
- Laveen
- Liberty
- Mobile
- Palo Verde
- Rainbow Valley
- Sunflower
- Tortilla Flat
- Waddell
Native American communities
- Fort McDowell Yavapai Nation
- Gila River Indian Community
- Salt River Pima–Maricopa Indian Community
- Tohono O’odham Indian Reservation
County population ranking
The population ranking of the following table is based on the 2010 census of Maricopa County.
† county seat
| Rank | City/Town/etc. | Population (2010 Census) | Population (2017 Estimate) | Municipal type | Incorporated |
|---|---|---|---|---|---|
| 1 | Phoenix † | 1,445,632 | 1,626,078 | City | 1881 |
| 2 | Mesa | 439,041 | 496,401 | City | 1878 (founded) |
| 3 | Chandler | 236,123 | 253,458 | City | 1920 |
| 4 | Scottsdale | 217,385 | 249,950 | City | 1951 |
| 5 | Glendale | 226,721 | 246,709 | City | 1910 |
| 6 | Gilbert | 208,453 | 242,354 | Town | 1920 |
| 7 | Tempe | 161,719 | 185,038 | City | 1894 |
| 8 | Peoria (partially in Yavapai County) | 154,065 | 168,181 | City | 1954 |
| 9 | Surprise | 117,517 | 134,085 | City | 1960 |
| 10 | Avondale | 76,238 | 84,025 | City | 1946 |
| 11 | Goodyear | 65,275 | 79,858 | City | 1946 |
| 12 | Buckeye | 50,876 | 68,453 | City | 1929 |
| 13 | Queen Creek (partially in Pinal County) | 26,361 | 39,184 | Town | 1990 |
| 14 | Sun City | 37,499 | — | CDP | |
| 15 | El Mirage | 31,797 | 35,216 | City | 1951 |
| 16 | Sun City West | 24,535 | — | CDP | |
| 17 | Fountain Hills | 22,489 | 24,583 | Town | 1989 |
| 18 | Anthem | 21,700 | — | CDP | |
| 19 | New River | 14,952 | — | CDP | |
| 20 | Paradise Valley | 12,820 | 14,293 | Town | 1961 |
| 21 | Sun Lakes | 13,975 | — | CDP |