
The national average HDI for India in 2008 was 0.467. By 2010, its average HDI had risen to 0.519. UNDP, the sponsor of Human Development Index methodology since 1990, reported India’s HDI to be 0.554 for 2012, an 18% increase over its 2008 HDI. United Nations declared India’s HDI is 0.586 in 2014, a 5.77% increase over 2012. As for the year 2018, HDI for India stood at 0.647.
HDI is composite index that takes into consideration (1) health, (2) Education and (3) Per capita income.
List
This is a list of Indian states and union territories by Human Development Index as of 2019.
| Rank | State/Union Territory | HDI (2019) | Comparable country |
|---|---|---|---|
| High human development | |||
| 1 | Kerala | 0.782 | |
| 2 | Chandigarh | 0.776 | |
| 3 | Goa | 0.763 | |
| 4 | Lakshadweep | 0.751 | |
| 5 | Delhi | 0.746 | |
| 6 | Andaman and Nicobar Islands | 0.741 | |
| 7 | Puducherry | 0.740 | |
| 8 | Himachal Pradesh | 0.725 | |
| 9 | Punjab | 0.724 | |
| 10 | Sikkim | 0.717 | |
| 11 | Tamil Nadu | 0.709 | |
| 12 | Daman and Diu | 0.708 | |
| Haryana | |||
| 14 | Mizoram | 0.704 | |
| Medium human development | |||
| 15 | Maharashtra | 0.697 | |
| Manipur | |||
| 17 | Jammu and Kashmir | 0.688 | |
| 18 | Uttarakhand | 0.683 | |
| 19 | Karnataka | ||
| 20 | Nagaland | 0.679 | |
| 21 | Gujarat | 0.672 | |
| 22 | Telangana | 0.669 | |
| 23 | Dadra and Nagar Haveli | 0.663 | |
| 24 | Arunachal Pradesh | 0.661 | |
| 25 | Tripura | 0.658 | |
| 26 | Meghalaya | 0.656 | |
| 27 | Andhra Pradesh | 0.649 | |
| – | 0.645 | ||
| 28 | West Bengal | 0.641 | |
| 29 | Rajasthan | 0.628 | |
| 30 | Assam | 0.613 | |
| 31 | Chhattisgarh | 0.611 | |
| 32 | Odisha | 0.606 | |
| 33 | Madhya Pradesh | 0.603 | |
| 34 | Jharkhand | 0.599 | |
| 35 | Uttar Pradesh | 0.596 | |
| 36 | Bihar | 0.574 | |
Trends by UNDP reports
Human Development Index (by UN Method) of Indian states since 1990 (2018 revision).
| State | HDI 1990 | HDI 1995 | HDI 2000 | HDI 2005 | HDI 2010 | HDI 2015 | HDI 2018 |
|---|---|---|---|---|---|---|---|
| Northern India | |||||||
| Chandigarh | 0.633 | 0.641 | 0.638 | 0.663 | 0.648 | 0.734 | 0.775 |
| New Delhi | 0.577 | 0.620 | 0.664 | 0.690 | 0.709 | 0.730 | 0.746 |
| Haryana | 0.467 | 0.506 | 0.549 | 0.591 | 0.634 | 0.686 | 0.708 |
| Himachal Pradesh | 0.479 | 0.530 | 0.589 | 0.644 | 0.667 | 0.704 | 0.725 |
| Jammu and Kashmir | 0.493 | 0.511 | 0.528 | 0.587 | 0.640 | 0.674 | 0.688 |
| Madhya Pradesh | 0.406 | 0.433 | 0.460 | 0.501 | 0.538 | 0.585 | 0.606 |
| Punjab | 0.496 | 0.536 | 0.578 | 0.615 | 0.657 | 0.703 | 0.723 |
| Uttar Pradesh | 0.397 | 0.429 | 0.463 | 0.504 | 0.535 | 0.577 | 0.596 |
| Uttarakhand | 0.629 | 0.635 | 0.630 | 0.656 | 0.641 | 0.664 | 0.684 |
| Western India | |||||||
| Dadra and Nagar Haveli | 0.672 | 0.683 | 0.684 | 0.709 | 0.696 | 0.663 | 0.663 |
| Daman and Diu | 0.651 | 0.662 | 0.664 | 0.688 | 0.677 | 0.690 | 0.708 |
| Goa | 0.552 | 0.581 | 0.614 | 0.671 | 0.737 | 0.754 | 0.761 |
| Gujarat | 0.470 | 0.498 | 0.527 | 0.573 | 0.606 | 0.651 | 0.672 |
| Maharashtra | 0.493 | 0.525 | 0.558 | 0.602 | 0.644 | 0.680 | 0.696 |
| Rajasthan | 0.403 | 0.436 | 0.469 | 0.510 | 0.548 | 0.605 | 0.629 |
| Eastern India | |||||||
| Andaman and Nicobar Islands | 0.683 | 0.693 | 0.694 | 0.720 | 0.707 | 0.721 | 0.739 |
| West Bengal | 0.440 | 0.473 | 0.505 | 0.539 | 0.572 | 0.619 | 0.641 |
| Bihar | 0.378 | 0.407 | 0.436 | 0.470 | 0.514 | 0.557 | 0.576 |
| Chhattisgarh | 0.562 | 0.569 | 0.564 | 0.588 | 0.574 | 0.594 | 0.613 |
| Jharkhand | 0.562 | 0.568 | 0.564 | 0.588 | 0.574 | 0.584 | 0.599 |
| Odisha | 0.400 | 0.429 | 0.458 | 0.494 | 0.535 | 0.585 | 0.606 |
| Northeastern India | |||||||
| Assam | 0.411 | 0.447 | 0.488 | 0.531 | 0.567 | 0.598 | 0.614 |
| Arunachal Pradesh | 0.437 | 0.471 | 0.502 | 0.535 | 0.641 | 0.661 | 0.660 |
| Manipur | 0.495 | 0.526 | 0.559 | 0.598 | 0.681 | 0.694 | 0.696 |
| Meghalaya | 0.456 | 0.469 | 0.477 | 0.533 | 0.620 | 0.648 | 0.656 |
| Mizoram | 0.525 | 0.547 | 0.569 | 0.630 | 0.686 | 0.698 | 0.705 |
| Nagaland | 0.531 | 0.533 | 0.522 | 0.557 | 0.661 | 0.679 | 0.679 |
| Sikkim | 0.541 | 0.548 | 0.548 | 0.590 | 0.633 | 0.691 | 0.716 |
| Tripura | 0.447 | 0.488 | 0.531 | 0.561 | 0.608 | 0.643 | 0.658 |
| Southern India | |||||||
| Andhra Pradesh | 0.424 | 0.450 | 0.478 | 0.530 | 0.580 | 0.629 | 0.650 |
| Karnataka | 0.444 | 0.479 | 0.518 | 0.565 | 0.605 | 0.659 | 0.682 |
| Kerala | 0.544 | 0.568 | 0.598 | 0.678 | 0.714 | 0.757 | 0.790 |
| Lakshadweep | 0.693 | 0.704 | 0.705 | 0.731 | 0.717 | 0.732 | 0.750 |
| Puducherry | 0.717 | 0.730 | 0.730 | 0.757 | 0.743 | 0.730 | 0.738 |
| Tamil Nadu | 0.471 | 0.504 | 0.542 | 0.599 | 0.646 | 0.689 | 0.708 |
| Telangana | 0.622 | 0.630 | 0.627 | 0.652 | 0.638 | 0.651 | 0.669 |
| India | 0.431 | 0.463 | 0.498 | 0.539 | 0.582 | 0.627 | 0.647 |
Trend analysis by Indian National Development Reports
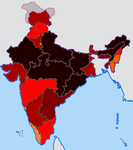
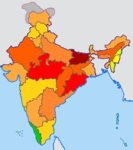
Compared with the previous Indian National Human Development Reports and the latest state-level government statistical report, India has significantly improved its HDI in all of its administrative subdivisions:
| Legend | ||||
|---|---|---|---|---|
| Very High/High Human Development Index
0.850–0.899
0.800–0.849
0.750–0.799
0.700–0.749
|
Medium human development index
0.650–0.699
0.600–0.649
0.550–0.599
0.500–0.549
|
Low human development index
0.450–0.499
0.400–0.449
0.350–0.399
0.300–0.349
0.250–0.299
≤0.250
|
Lack of information
|
|

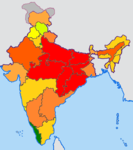
Human Development Index map for Indian states in 2006, as calculated by Government of India and UNDP India.
This is a list of Indian states by their respective Human Development Index (HDI), as of 2008. Kerala stands first in Human Development Index among the states in India.
- 1981 to 2005 human development index in India
-

National Human Development Report 1981
(1981 data) -
National Human Development Report 1991
(1991 data) -

National Human Development Report 2001
(2001 data) -
State-level Census and Statistics 2008 report
(2005 data) -
National Human Development Report 2011
(2007–2008 data)
Consumption-based HDI
There are many ways to calculate HDI, and its calculation is sensitive to base data and assumptions. Using another approach, UNDP India and Government of India calculated the HDI nationwide average to be 0.605 in 2006. This data was published by the Indian Government. Note that the 2007-2008 HDI values in the table below is not based on income as is the UNDP standard practice for global comparisons, but on estimated consumption expenditure – an assumption which underestimates the HDI compared to the actual value. Further, data was unavailable for the following union territories: Chandigarh, Lakshadweep, Andaman and Nicobar Islands, Daman and Diu, Puducherry, and Dadra and Nagar Haveli.
| Rank | State/Union Territory | consumption based HDI[15] (2007–08)for Indian states only |
|---|---|---|
| 1 | Kerala | 0.810 |
| 2 | Delhi | 0.750 |
| 3 | Himachal Pradesh | 0.652 |
| 4 | Goa | 0.617 |
| 5 | Punjab | 0.605 |
| 6 | Northeast India (excluding Assam) | 0.573 |
| 7 | Maharashtra | 0.572 |
| 8 | Tamil Nadu | 0.570 |
| 9 | Haryana | 0.552 |
| 10 | Jammu and Kashmir | 0.542 |
| 11 | Gujarat | 0.527 |
| 12 | Karnataka | 0.519 |
| – | National average | 0.513 |
| 13 | West Bengal | 0.492 |
| 14 | Uttarakhand | 0.490 |
| 15 | Andhra Pradesh | 0.473 |
| 16 | Assam | 0.444 |
| 17 | Rajasthan | 0.434 |
| 18 | Uttar Pradesh | 0.380 |
| 19 | Jharkhand | 0.376 |
| 20 | Madhya Pradesh | 0.375 |
| 21 | Bihar | 0.367 |
| 22 | Odisha | 0.362 |
| 23 | Chhattisgarh | 0.358 |