
The population of Afghanistan is around 37,466,414 as of 2021,which includes the roughly 3 million Afghan citizens living as refugees in both Pakistan and Iran. The nation is composed of a multi-ethnic and multilingualsociety, reflecting its location astride historic trade and invasion routes between Central Asia, Southern Asia, and Western Asia. Ethnic groups in the country include Pashtun, Tajik, Hazara, Uzbeks, Nuristanis, Aimaq, Turkmen, Balochand a number of others which are less known.
Approximately 46% of the population is under 15 years of age, and 74% of all Afghans live in rural areas. The average woman gives birth to five children during her entire life, the highest fertility rateoutside of Africa. About 6.8% of all babies die in child-birth or infancy. The average life expectancy of the nation was reported in 2019 at around 63 years, and only 0.04% of the population has HIV.
Pashto and Dari are both the official languages of the country. Dari, which is known as the Afghan Persian, historically functioned as the lingua franca. Pashto is widely used in the regions south of the Hindu Kush mountains and as far as the Indus River in neighboring Pakistan. Uzbek and Turkmen are smaller languages spoken in parts of the north. Multilingualism is common throughout the country, especially in the major cities.
Islam is the religion of more than 99% of Afghanistan’s citizens. Up to 89.7% of the population practices Sunni Islam and belongs to the Hanafi Islamic law school, while 10–15% are followers of Shia Islam; the majority of whom belong to the Twelverbranch, with smaller numbers of Ismailis. The remaining 0.3% practice other religions such as Sikhism and Hinduism. Excluding urban populations in the principal cities, most people are organized into tribal and other kinship-based groups, who follow their own traditional customs. About 74% of the country’s population lives in rural areas and 26% in the cities.
Contents
- Population statistics
- Historical
- Current and latest
- Age structure
- Population growth rate
- Urbanization
- Sex ratio
- Vital statistics
- UN estimates
- Fertility and births
- Structure of the population
- Life expectancy
- Development and health indicators
- Literacy
- School life expectancy (primary to tertiary education)
- HIV/AIDS – adult prevalence rate
- HIV/AIDS – people living with HIV/AIDS
- HIV/AIDS – deaths
- Major infectious diseases
- Ethnic groups
- Languages
- Religion
- See also
- References
- Further reading
- External links
Population statistics
Historical

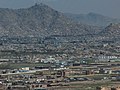
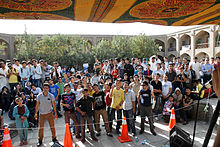
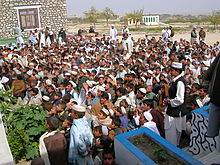
Sport fans inside the Ghazi Stadiumin the capital of Kabul, which is multi-ethnic and the largest city of Afghanistan.
The first nationwide census of Afghanistan was carried out only in 1979, but previously there had been scattered attempts to conduct censuses in individual cities. According to the 1876 census, Kabul had a population of 140,700 people. In Kandahar in 1891 a population census was carried out, according to which 31,514 people lived in the city, of which 16,064 were men and 15,450 were women.
In 1979 the total population was reported to be about 15.5 million. From 1979 until the end of 1983, some 5 million people left the country to take shelter in neighboring northwestern Pakistan and eastern Iran. This exodus was largely unchecked by any government. The Afghan government in 1983 reported a population of 15.96 million, which presumably included the exodus.
It is assumed that roughly 600,000 to as high as 2 million Afghans may have been killed during the various 1979–2001 wars. These figures are questionable and no attempt has ever been made to verify if they were actually killed or had moved to neighboring countries as refugees.
Current and latest
As of 2021, the total population of Afghanistan is around 37,466,414, which includes the 3 million Afghan nationals living in both Pakistan and Iran. About 26% of the population is urbanite and the remaining 74% lives in rural areas.
Afghanistan’s Central Statistics Organization (CSO) stated in 2011 that the total number of Afghans living inside Afghanistan was about 26 million and by 2017 it reached 29.2 million. Of this, 15 million are males and 14.2 million are females. The country’s population is expected to reach 82 million by 2050.
Urban areas have experienced rapid population growth in the last decade, which is due to the return of over 5 million expats. The only city in Afghanistan with over a million residents is its capital, Kabul. The other largest cities in the country are shown in the chart below.
|
Largest cities or towns in Afghanistan 2019 estimate
|
|||||||||
|---|---|---|---|---|---|---|---|---|---|
| Rank | Name | Province | Pop. | ||||||
 Kabul 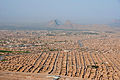 Kandahar |
1 | Kabul | Kabul Province | 4,273,200 | 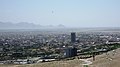 Herat  Mazar-i-Sharif |
||||
| 2 | Kandahar | Kandahar Province | 614,300 | ||||||
| 3 | Herat | Herat Province | 556,200 | ||||||
| 4 | Mazar-i-Sharif | Balkh Province | 469,200 | ||||||
| 5 | Kunduz | Kunduz Province | 356,500 | ||||||
| 6 | Jalalabad | Nangarhar Province | 263,200 | ||||||
| 7 | Taloqan | Takhar Province | 253,700 | ||||||
| 8 | Puli Khumri | Baghlan Province | 237,900 | ||||||
| 9 | Ghazni | Ghazni Province | 183,000 | ||||||
| 10 | Khost | Khost Province | 153,300 | ||||||
Age structure

Population pyramid 2016
0–14 years: 40.62% (male 7,562,703/female 7,321,646)
15-24 years: 21.26% (male 3,960,044/female 3,828,670)
25-54 years: 31.44% (male 5,858,675/female 5,661,887)
55-64 years: 4.01% (male 724,597/female 744,910)
65 years and over: 2.68% (male 451,852/female 528,831) (2020 est.)
Population growth rate
2.34% (2021)
country comparison to the world: 39
Urbanization
Young Afghans at a music festival inside the Gardens of Babur in Kabul.
urbanization population: 26% of the total population (2020)
rate of urbanization: 3.37% annual rate of change (2015-20)
Sex ratio
at birth: 1.05 male(s)/female
0-14 years: 1.03 male(s)/female
15-24 years: 1.03 male(s)/female
25-54 years: 1.03 male(s)/female
55-64 years: 0.97 male(s)/female
65 years and over: 0.85 male(s)/female
total population: 1.05 male(s)/female (2020)
Vital statistics
UN estimates
| Period | Live births per year | Deaths per year | Natural change per year | CBR1 | CDR1 | NC1 | TFR1 | IMR1 |
|---|---|---|---|---|---|---|---|---|
| 1950–1955 | 403,000 | 295,000 | 108,000 | 52.9 | 36.9 | 16.0 | 7.45 | 275.0 |
| 1955–1960 | 440,000 | 291,000 | 149,000 | 52.9 | 34.8 | 18.1 | 7.45 | 260.6 |
| 1960–1965 | 488,000 | 295,000 | 192,000 | 52.8 | 32.7 | 20.2 | 7.45 | 245.4 |
| 1965–1970 | 545,000 | 304,000 | 242,000 | 52.6 | 30.3 | 22.4 | 7.45 | 228.1 |
| 1970–1975 | 610,000 | 313,000 | 297,000 | 52.1 | 27.9 | 24.2 | 7.45 | 211.4 |
| 1975–1980 | 657,000 | 307,000 | 350,000 | 51.5 | 25.6 | 26.0 | 7.45 | 194.5 |
| 1980–1985 | 630,000 | 259,000 | 371,000 | 51.8 | 24.1 | 27.7 | 7.45 | 182.8 |
| 1985–1990 | 597,000 | 207,000 | 390,000 | 52.2 | 22.7 | 29.5 | 7.47 | 171.9 |
| 1990–1995 | 714,000 | 210,000 | 505,000 | 52.6 | 21.4 | 31.2 | 7.48 | 161.8 |
| 1995–2000 | 914,000 | 239,000 | 675,000 | 52.4 | 20.1 | 32.3 | 7.65 | 152.3 |
| 2000–2005 | 1,057,000 | 248,000 | 810,000 | 48.4 | 18.3 | 30.1 | 7.18 | 143.7 |
| 2005–2010 | 1,142,000 | 240,000 | 902,000 | 45.1 | 16.8 | 28.3 | 6.37 | 136.0 |
| 2010–2015 | 1,130,000 | 233,000 | 897,000 | 45.1 | 16.8 | 28.3 | 5.26 | 136.0 |
| 2015–2020 | 1,158,000 | 234,000 | 924,000 | 45.1 | 16.8 | 28.3 | 4.41 | 136.0 |
| 2020–2025 | 1,167,000 | 240,000 | 927,000 | 45.1 | 16.8 | 28.3 | 3.71 | 136.0 |
| 1 CBR = crude birth rate (per 1000); CDR = crude death rate (per 1000); NC = natural change (per 1000); TFR = total fertility rate (number of children per woman); IMR = infant mortality rate per 1000 births | ||||||||
| <Source: | ||||||||
Fertility and births
Total Fertility Rate (TFR) (Wanted Fertility Rate) and Crude Birth Rate (CBR):
| Year | CBR (Total) | TFR (Total) | CBR (Urban) | TFR (Urban) | CBR (Rural) | TFR (Rural) |
|---|---|---|---|---|---|---|
| 2010 | 35.6 | 5.1 | 34.7 | 4.5 | 35.9 | 5.2 |
| 2015 | 36.8 | 5.3 (4.4) | 35.8 | 4.8 (3.7) | 37.1 | 5.4 (4.6) |
Fertility data by province (DHS Program):
| Province | Total fertility rate (2015) |
|---|---|
| Kabul | 4.6 |
| Kapisa | 4.8 |
| Parwan | 5.7 |
| Wardak | 4.2 |
| Logar | 4.2 |
| Nangarhar | 6.4 |
| Laghman | 7.3 |
| Panjshir | 3.2 |
| Baghlan | 4.4 |
| Bamyan | 5.4 |
| Ghazni | 2.8 |
| Paktika | 5.3 |
| Paktia | 5.2 |
| Khost | 5.6 |
| Kunar | 6.8 |
| Nuristan | 8.9 |
| Badakhshan | 5.3 |
| Takhar | 5.7 |
| Kunduz | 4.4 |
| Samangan | 5.1 |
| Balkh | 5.5 |
| Sar-e Pol | 4.8 |
| Ghor | 5.8 |
| Daykundi | 5.2 |
| Urozgan | 8.8 |
| Zabul | 5.1 |
| Kandahar | 6.5 |
| Jawzjan | 3.9 |
| Faryab | 6.2 |
| Helmand | 4.7 |
| Badghis | 6.6 |
| Herat | 4.8 |
| Farah | 5.4 |
| Nimruz | 5.4 |
Structure of the population
Structure of the population (2012.01.07) (Data refer to the settled population based on the 1979 Population Census and the latest household prelisting. The refugees of Afghanistan in Iran, Pakistan, and an estimated 1.5 million nomads, are not included):
| showPopulation pyramid 2012 |
|---|
| showAge group | Male | Female | Total | Percent |
|---|
Life expectancy
total population: 63.2 years (2019)
country comparison to the world: 214
male: 63.3 years (2019)
female: 63.2 years (2019)
| Period | Life expectancy in Years |
Period | Life expectancy in Years |
|---|---|---|---|
| 1950–1955 | 28.6 | 1985–1990 | 47.7 |
| 1955–1960 | 31.1 | 1990–1995 | 51.7 |
| 1960–1965 | 33.4 | 1995–2000 | 54.2 |
| 1965–1970 | 35.6 | 2000–2005 | 56.9 |
| 1970–1975 | 37.8 | 2005–2010 | 60.0 |
| 1975–1980 | 40.4 | 2010–2015 | 62.3 |
| 1980–1985 | 43.6 | 2015-2020 | 63.2 |
Source: UN World Population Prospects
Development and health indicators
Gathering of students in 2006 at a school in Nangarhar Province.
Literacy
- Definition: People over the age of 15 that can read and write
- Total population: 43% (2018)
- Male: 55.5%
- Female: 29.8%
School life expectancy (primary to tertiary education)
total: 10 years
male: 13 years
female: 8 years (2018)
HIV/AIDS – adult prevalence rate
0.04% (2015)
HIV/AIDS – people living with HIV/AIDS
Up to 6,900 (2015 estimate)
In 2008, health officials in Afghanistan reported 504 cases of people living with HIV but by the end of 2012 the numbers reached 1,327. The nation’s healthy ministry stated that most of the HIV patients were among intravenous drug users and that 70% of them were men, 25% women, and the remaining 5% children. They belonged to Kabul, Kandahar and Herat, the provinces from where people make the most trips to neighboring and foreign countries. Regarding Kandahar, 22 cases were reported in 2012. “AIDS Prevention department head Dr Hamayoun Rehman said 1,320 blood samples were examined and 21 were positive. Among the 21 patients, 18 were males and three were females who contracted the deadly virus from their husbands. He said four people had reached a critical stage while three had died. The main source of the disease was the use of syringes used by drug addicts.” There are approximately 23,000 addicts in the country who inject drugs into their bodies using syringes
country comparison to the world: 168
HIV/AIDS – deaths
Up to 300 (2015 estimate)
Major infectious diseases
Degree of risk: high
- Food or waterborne diseases: bacterial and protozoal diarrhea, hepatitis A, and typhoid fever
- Vector-borne diseases: malaria
- Animal contact diseases: rabies
Note: WH5N1 avian influenza has been identified in this country; it poses a negligible risk as of 2009.
Ethnic groups
In recent years, a nationwide distribution of Afghan e-ID cards (e-Tazkiras) began. The ethnicity of each citizen is provided in the application. This process is expected to reveal the exact figures about the size and composition of the country’s ethnic groups. Article Four of the Afghan Constitution mentions 14 ethnic groups by names but some Afghans belong to other such groups. An approximate distribution of the ethnolinguistic groups are listed in the chart below:

A 2005 CIA map showing the various Afghan tribal territories
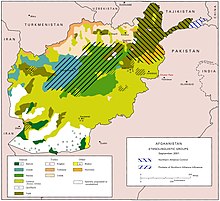
Ethnolinguistic groups in Afghanistan in 2001
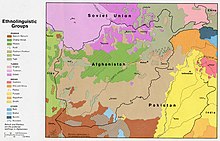
Ethnolinguistic groups in Afghanistan in 1982
| Ethnic group | Image | Recent estimate | Pre-2004 estimates |
|---|---|---|---|
| Pashtun |  |
42% | 38-50% |
| Tajik |  |
27% | 25–26.3% (of this 1% is Qizilbash) |
| Hazara |  |
9% | 12-19% |
| Uzbek |  |
9% | 6-8% |
| Aimak | 4% | 500,000-800,000 individuals | |
| Turkmen | 3% | 2.5% | |
| Baloch | 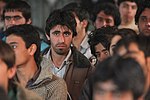 |
2% | 100,000 individuals |
| Others (Pashai, Nuristani, Arab, Brahui, Pamiri, Gujjar, etc.) |  |
4% | 6.9% |
The recent estimate in the above chart is somewhat supported by the below national opinion polls, which were aimed at knowing how a group of about 804 to 8,706 local residents in Afghanistan felt about the current war, political situation, as well as the economic and social issues affecting their daily lives. Ten surveys were conducted between 2004 and 2015 by the Asia Foundation (a sample is shown in the table below; the survey in 2015 did not contain information on the ethnicity of the participants) and one between 2004 and 2009 by a combined effort of the broadcasting companies NBC News, BBC, and ARD.
| Ethnic group | “Afghanistan: Where Things Stand” (2004–2009) | “A survey of the Afghan people” (2006) | “A survey of the Afghan people” (2007) | “A survey of the Afghan people” (2012) | “A survey of the Afghan people” (2014) | “A survey of the Afghan people” (2018) |
|---|---|---|---|---|---|---|
| Tajik | 25-35% | 39.1% | 35% | 36% | 38% | 37% |
| Pashtun | 47-57% | 47.9% | 47% | 48% | 48% | 37% |
| Hazara | 15% | 17% | 16-18% | 18% | 20% | 10% |
| Uzbek | 8% | 10% | 13% | 14% | 14% | 9% |
| Aimak | 10-15% | 1% | 1% | 1% | 1% | 1% |
| Turkmen | 1-2% | 1.7% | 3% | 2% | 2% | 2% |
| Baloch | 2% | 5% | 6% | 6% | 8% | 1% |
| Others (Pashayi, Nuristani, Arab, Qizilbash.) | 0-4% | 1.4% | 2% | 3% | 5% | 2% |
| No opinion | 0-2% | 0% | 0% | 0% | 0% | 1% |
Languages
Pashto and Dari are both the official languages of Afghanistan. Dari, which is recognized as the Afghan Persian, has been historically the language resorted to when people of different ethnic groups need to conduct business or otherwise communicate. In recent years, however, both official languages must be understood in order to obtain employment with the central government, especially as a politician.
Hazaragi, Uzbeki and Turkmeni are spoken as native languages in the central and northern provinces, mainly among the Hazara, Uzbek and Turkmen tribes. Smaller number of Afghans are also fluent in English, Urdu, Balochi, Arabic and other languages. An approximate distribution of languages spoken in the country is shown in the chart below:
| Language | Recent estimate | Pre-1992 estimates | ||||||
|---|---|---|---|---|---|---|---|---|
| Dari | 77% | 25-50% | ||||||
| Pashto | 48% | 50-55% | ||||||
| Uzbek | 11% | 9% | ||||||
| English | 6% | |||||||
| Turkmen | 3% | 500,000 speakers | ||||||
| Urdu | 3% | |||||||
| Pashayi | 1% | |||||||
| Nuristani | 1% | |||||||
| Arabic | 1% | |||||||
| Balochi | 1% | |||||||
| 1 note: data represent most widely spoken languages; shares sum to more than 100% because there is much bilingualism in the country and because respondents were allowed to select more than one language note: the Turkic languages Uzbek and Turkmen, as well as Balochi, Pashayi, Nuristani, and Pamiri are the third official languages in areas where the majority speaks them |
||||||||
Based on information from the latest national opinion polls, up to 51% stated that they can speak or understand Pashto and up to 79% stated that they can speak or understand Dari. Uzbeki was spoken or understood by up to 11% and Turkmen by up to 7%. Other languages that can be spoken are Arabic (4%) and Balochi (2%).
Religion
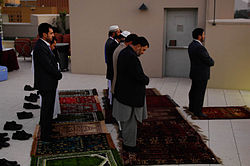
Afghan politicians and foreign diplomats praying at the U.S. Embassy in Kabul.
Almost the entire Afghan population is Muslim, with less than 1% being non-Muslim. Despite attempts to secularize Afghan society, Islamic practices pervade all aspects of life. Likewise, Islamic religious tradition and codes, together with traditional practices, provide the principal means of controlling personal conduct and settling legal disputes. Islam was used as the main basis for expressing opposition to the modernization of Afghanistan by King Amanullah in the 1920s. It was also used by the mujahideen during the 1980s Soviet–Afghan War and by the Taliban today.
The members of Sikh and Hindu communities are mostly concentrated in urban areas. They numbered hundreds of thousands in the 1970s but over 90% have since fled due to the Afghan wars and persecution.
- Islam: 99.7% of the total population
- Sunni Muslim: 84.7-89.7%
- Shia Muslim: 10-15%
- others: 0.3%
- Baha’is in the hundreds
- Sikhism: In the hundreds
- Hinduism: In the hundreds
- Zoroastrianism: Unknown/unreported
- Christianity: Unknown
- Judaism (one known individual: Zablon Simintov)
- Buddhism: Unknown
| Religion | “A survey of the Afghan people” (2004) | “A survey of the Afghan people” (2006) | “A survey of the Afghan people” (2007) | “A survey of the Afghan people” (2008) | “A survey of the Afghan people” (2009) | “A survey of the Afghan people” (2010) | “A survey of the Afghan people” (2011) | “A survey of the Afghan people” (2012) |
|---|---|---|---|---|---|---|---|---|
| Sunni Islam | 65% | 67.9% | 67% | “ | “ | “ | “ | “ |
| Shia Islam | 27% | 30.4% | 32% | “ | “ | “ | “ | “ |
| Ismailism | 1% | 1.2% | 0% | “ | “ | “ | “ | “ |
| Hinduism | 0% | 0.1% | 0% | “ | “ | “ | “ | “ |
| Buddhism | 0% | 0.1% | 0% | “ | “ | “ | “ | “ |
| Sikhism | 0% | 0.1% | 0% | “ | “ | “ | “ | “ |