
IQ classification is the practice by IQ test publishers of labeling IQ score ranges with category names such as “superior” or “average”.
The current scoring method for all IQ tests is the “deviation IQ”. In this method, an IQ score of 100 means that the test-taker’s performance on the test is at the median level of performance in the sample of test-takers of about the same age used to norm the test. An IQ score of 115 means performance one standard deviation above the median, a score of 85 performance, one standard deviation below the median, and so on. Lewis Terman and other early developers of IQ tests noticed that most child IQ scores come out to approximately the same number by either procedure. Deviation IQs are now used for standard scoring of all IQ tests in large part because they allow a consistent definition of IQ for both children and adults. By the current “deviation IQ” definition of IQ test standard scores, about two-thirds of all test-takers obtain scores from 85 to 115, and about 5 percent of the population scores above 125.
All IQ tests show variation in scores even when the same person takes the same test over and over again. IQ scores also differ for a test-taker taking tests from more than one publisher at the same age. The various test publishers do not use uniform names or definitions for IQ score classifications.
Even before IQ tests were invented, there were attempts to classify people into intelligence categories by observing their behavior in daily life. Those other forms of behavioral observation are still important for validating classifications based primarily on IQ test scores. Both intelligence classification by observation of behavior outside the testing room and classification by IQ testing depend on the definition of “intelligence” used in a particular case and on the reliability and error of estimation in the classification procedure.
Variance in individual IQ classification
| Pupil | KABC-II | WISC-III | WJ-III |
|---|---|---|---|
| Asher | 90 | 95 | 111 |
| Brianna | 125 | 110 | 105 |
| Colin | 100 | 93 | 101 |
| Danica | 116 | 127 | 118 |
| Elpha | 93 | 105 | 93 |
| Fritz | 106 | 105 | 105 |
| Georgi | 95 | 100 | 90 |
| Hector | 112 | 113 | 103 |
| Imelda | 104 | 96 | 97 |
| Jose | 101 | 99 | 86 |
| Keoku | 81 | 78 | 75 |
| Leo | 116 | 124 | 102 |
IQ tests generally are reliable enough that most people ages ten and older have similar IQ scores throughout life. Still, some individuals score very differently when taking the same test at different times or when taking more than one kind of IQ test at the same age. For example, many children in the famous longitudinal Genetic Studies of Genius begun in 1921 by Lewis Terman showed declines in IQ as they grew up. Terman recruited school pupils based on referrals from teachers, and gave them his Stanford–Binet IQ test. Children with an IQ above 140 by that test were included in the study. There were 643 children in the main study group. When the students who could be contacted again (503 students) were retested at high school age, they were found to have dropped 9 IQ points on average in Stanford–Binet IQ. More than two dozen children dropped by 15 IQ points and six by 25 points or more. Yet parents of those children thought that the children were still as bright as ever, or even brighter.
Because all IQ tests have error of measurement in the test-taker’s IQ score, a test-giver should always inform the test-taker of the confidence interval around the score obtained on a given occasion of taking each test. IQ scores are ordinal scores and are not expressed in an interval measurement unit. Besides the inherent error band around any IQ test score because tests are a “sample racks of learned behavior”, IQ scores can also be misleading because test-givers fail to follow standardized administration and scoring procedures. In cases of test-giver mistakes, the usual result is that tests are scored too leniently, giving the test-taker a higher IQ score than the test-taker’s performance justifies. Some test-givers err by showing a “halo effect”, with low-IQ individuals receiving IQ scores even lower than if standardized procedures were followed, while high-IQ individuals receive inflated IQ scores.
IQ classifications for individuals also vary because category labels for IQ score ranges are specific to each brand of test. The test publishers do not have a uniform practice of labeling IQ score ranges, nor do they have a consistent practice of dividing up IQ score ranges into categories of the same size or with the same boundary scores. Thus psychologists should specify which test was given when reporting a test-taker’s IQ. Psychologists and IQ test authors recommend that psychologists adopt the terminology of each test publisher when reporting IQ score ranges.
IQ classifications from IQ testing are not the last word on how a test-taker will do in life, nor are they the only information to be considered for placement in school or job-training programs. There is still a dearth of information about how behavior differs between persons with differing IQ scores. For placement in school programs, for medical diagnosis, and for career advising, factors other than IQ must also be part of an individual assessment.
The lesson here is that classification systems are necessarily arbitrary and change at the whim of test authors, government bodies, or professional organizations. They are statistical concepts and do not correspond in any real sense to the specific capabilities of any particular person with a given IQ. The classification systems provide descriptive labels that may be useful for communication purposes in a case report or conference, and nothing more.
— Alan S. Kaufman and Elizabeth O. Lichtenberger, Assessing Adolescent and Adult Intelligence (2006)
IQ classification tables for current tests
There are a variety of individually administered IQ tests in use in the English-speaking world. Not all report test results as “IQ”, but most now report a standard score with a median score level of 100. When a test-taker scores higher or lower than the median score, the score is indicated as 15 standard score points higher or lower for each standard deviation difference higher or lower in the test-taker’s performance on the test item content.
Wechsler Intelligence Scales
The Wechsler intelligence scales were originally developed from earlier intelligence scales by David Wechsler. The first Wechsler test published was the Wechsler–Bellevue Scale in 1939. The Wechsler IQ tests for children and for adults are the most frequently used individual IQ tests in the English-speaking world and in their translated versions are perhaps the most widely used IQ tests worldwide. The Wechsler tests have long been regarded as the “gold standard” in IQ testing. The Wechsler Adult Intelligence Scale—Fourth Edition (WAIS–IV) was published in 2008 by The Psychological Corporation. The Wechsler Intelligence Scale for Children—Fifth Edition (WISC–V) was published in 2014 by The Psychological Corporation, and the Wechsler Preschool and Primary Scale of Intelligence—Fourth Edition (WPPSI–IV) was published in 2012 by The Psychological Corporation. Like all current IQ tests, the Wechsler tests report a “deviation IQ” as the standard score for the full-scale IQ, with the norming sample median raw score defined as IQ 100 and a score one standard deviation higher defined as IQ 115 (and one deviation lower defined as IQ 85).
| IQ Range (“deviation IQ”) | IQ Classification |
|---|---|
| 130 and above | Very Superior |
| 120–129 | Superior |
| 110–119 | High Average |
| 90–109 | Average |
| 80–89 | Low Average |
| 70–79 | Borderline |
| 69 and below | Extremely Low |
| IQ Range (“deviation IQ”) | IQ Classification |
|---|---|
| 130 and above | Extremely High |
| 120–129 | Very High |
| 110–119 | High Average |
| 90–109 | Average |
| 80–89 | Low Average |
| 70–79 | Very Low |
| 69 and below | Extremely Low |
Psychologists have proposed alternative language for Wechsler IQ classifications. The term “borderline”, which implies being very close to being intellectually disabled, is replaced in the alternative system by a term that doesn’t imply a medical diagnosis.
| Corresponding IQ Range | Classifications | More value-neutral terms |
|---|---|---|
| 130+ | Very superior | Upper extreme |
| 120–129 | Superior | Well above average |
| 110–119 | High average | High average |
| 90–109 | Average | Average |
| 80–89 | Low average | Low average |
| 70–79 | Borderline | Well below average |
| 69 and below | Extremely low | Lower extreme |
Stanford–Binet Intelligence Scale Fifth Edition
The current fifth edition of the Stanford–Binet scales (SB5) was developed by Gale H. Roid and published in 2003 by Riverside Publishing. Unlike scoring on previous versions of the Stanford–Binet test, SB5 IQ scoring is deviation scoring in which each standard deviation up or down from the norming sample median score is 15 points from the median score, IQ 100, just like the standard scoring on the Wechsler tests.
| IQ Range (“deviation IQ”) | IQ Classification |
|---|---|
| 144+ | Very gifted or highly advanced |
| 130–144 | Gifted or very advanced |
| 120–129 | Superior |
| 110–119 | High average |
| 90–109 | Average |
| 80–89 | Low average |
| 70–79 | Borderline impaired or delayed |
| 55–69 | Mildly impaired or delayed |
| 40–54 | Moderately impaired or delayed |
Woodcock–Johnson Test of Cognitive Abilities
The Woodcock–Johnson a III NU Tests of Cognitive Abilities (WJ III NU) was developed by Richard W. Woodcock, Kevin S. McGrew and Nancy Mather and published in 2007 by Riverside. The WJ III classification terms are not applied.
| IQ Score | WJ III Classification |
|---|---|
| 131 and above | Very superior |
| 121 to 130 | Superior |
| 111 to 120 | High Average |
| 90 to 110 | Average |
| 80 to 89 | Low Average |
| 70 to 79 | Low |
| 69 and below | Very Low |
Kaufman Tests
The Kaufman Adolescent and Adult Intelligence Test was developed by Alan S. Kaufman and Nadeen L. Kaufman and published in 1993 by American Guidance Service. Kaufman test scores “are classified in a symmetrical, nonevaluative fashion”, in other words the score ranges for classification are just as wide above the median as below the median, and the classification labels do not purport to assess individuals.
| 130 and above | Upper Extreme |
|---|---|
| 120–129 | Well Above Average |
| 110–119 | Above average |
| 90–109 | Average |
| 80–89 | Below Average |
| 70–79 | Well Below Average |
| 69 and below | Lower Extreme |
The Kaufman Assessment Battery for Children, Second Edition was developed by Alan S. Kaufman and Nadeen L. Kaufman and published in 2004 by American Guidance Service.
| Range of Standard Scores | Name of Category |
|---|---|
| 131–160 | Upper Extreme |
| 116–130 | Above Average |
| 85–115 | Average Range |
| 70–84 | Below Average |
| 40–69 | Lower Extreme |
Cognitive Assessment System
The Das-Naglieri Cognitive Assessment System test was developed by Jack Naglieri and J. P. Das and published in 1997 by Riverside.
| Standard Scores | Classification |
|---|---|
| 130 and above | Very Superior |
| 120–129 | Superior |
| 110–119 | High Average |
| 90–109 | Average |
| 80–89 | Low Average |
| 70–79 | Below Average |
| 69 and below | Well Below Average |
Differential Ability Scales
The Differential Ability Scales Second Edition (DAS–II) was developed by Colin D. Elliott and published in 2007 by Psychological Corporation. The DAS-II is a test battery given individually to children, normed for children from ages two years and six months through seventeen years and eleven months. It was normed on 3,480 noninstitutionalized, English-speaking children in that age range. The DAS-II yields a General Conceptual Ability (GCA) score scaled like an IQ score with the median standard score set at 100 and 15 standard score points for each standard deviation up or down from the median. The lowest possible GCA score on DAS–II is 30, and the highest is 170.
| GCA | General Conceptual Ability Classification |
|---|---|
| ≥ 130 | Very high |
| 120–129 | High |
| 110–119 | Above average |
| 90–109 | Average |
| 80–89 | Below average |
| 70–79 | Low |
| ≤ 69 | Very low |
Reynolds Intellectual Ability Scales
Reynolds Intellectual Ability Scales (RIAS) were developed by Cecil Reynolds and Randy Kamphaus. The RIAS was published in 2003 by Psychological Assessment Resources.
| Intelligence test score range | Verbal descriptor |
|---|---|
| ≥ 130 | Significantly above average |
| 120–129 | Moderately above average |
| 110–119 | Above average |
| 90–109 | Average |
| 80–89 | Below average |
| 70–79 | Moderately below average |
| ≤ 69 | Significantly below average |
Historical IQ classification tables
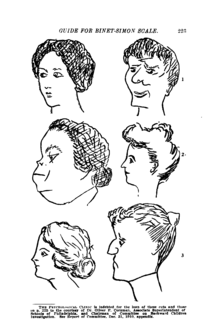
Reproduction of an item from the 1908 Binet–Simon intelligence scale, showing three pairs of pictures, about which the tested child was asked, “Which of these two faces is the prettier?” Reproduced from the article “A Practical Guide for Administering the Binet–Simon Scale for Measuring Intelligence” by J. E. Wallace Wallin in the March 1911 issue of the journal The Psychological Clinic (volume 5 number 1), public domain.
Lewis Terman, developer of the Stanford–Binet Intelligence Scales, based his English-language Stanford–Binet IQ test on the French-language Binet–Simon test developed by Alfred Binet. Terman believed his test measured the “general intelligence” construct advocated by Charles Spearman (1904). Terman differed from Binet in reporting scores on his test in the form of intelligence quotient (“mental age” divided by chronological age) scores after the 1912 suggestion of German psychologist William Stern. Terman chose the category names for score levels on the Stanford–Binet test. When he first chose classification for score levels, he relied partly on the usage of earlier authors who wrote, before the existence of IQ tests, on topics such as individuals unable to care for themselves in independent adult life. Terman’s first version of the Stanford–Binet was based on norming samples that included only white, American-born subjects, mostly from California, Nevada, and Oregon.
| IQ Range (“ratio IQ”) | IQ Classification |
|---|---|
| Above 140 | “Near” genius or genius |
| 120–140 | Very superior intelligence |
| 110–120 | Superior intelligence |
| 90–110 | Normal, or average, intelligence |
| 80–90 | Dullness, rarely classifiable as feeble-mindedness |
| 70–80 | Border-line deficiency, sometimes classifiable as dullness, often as feeble-mindedness |
| Below 70 | Definite feeble-mindedness |
Rudolph Pintner proposed a set of classification terms in his 1923 book Intelligence Testing: Methods and Results. Pintner commented that psychologists of his era, including Terman, went about “the measurement of an individual’s general ability without waiting for an adequate psychological definition.” Pintner retained these terms in the 1931 second edition of his book.
| IQ Range (“ratio IQ”) | IQ Classification |
|---|---|
| 130 and above | Very Superior |
| 120–129 | Very Bright |
| 110–119 | Bright |
| 90–109 | Normal |
| 80–89 | Backward |
| 70–79 | Borderline |
Albert Julius Levine and Louis Marks proposed a broader set of categories in their 1928 book Testing Intelligence and Achievement. Some of the terminology in the table came from contemporary terms for classifying individuals with intellectual disabilities.
| IQ Range (“ratio IQ”) | IQ Classification |
|---|---|
| 175 and over | Precocious |
| 150–174 | Very superior |
| 125–149 | Superior |
| 115–124 | Very bright |
| 105–114 | Bright |
| 95–104 | Average |
| 85–94 | Dull |
| 75–84 | Borderline |
| 50–74 | Morons |
| 25–49 | Imbeciles |
| 0–24 | Idiots |
The second revision (1937) of the Stanford–Binet test retained “quotient IQ” scoring, despite earlier criticism of that method of reporting IQ test standard scores. The term “genius” was no longer used for any IQ score range. The second revision was normed only on children and adolescents (no adults), and only “American-born white children”.
| IQ Range (“ratio IQ”) | IQ Classification |
|---|---|
| 140 and over | Very superior |
| 120–139 | Superior |
| 110–119 | High average |
| 90–109 | Normal or average |
| 80–89 | Low average |
| 70–79 | Borderline defective |
| Below 70 | Mentally defective |
A data table published later as part of the manual for the 1960 Third Revision (Form L-M) of the Stanford–Binet test reported score distributions from the 1937 second revision standardization group.
| IQ Range (“ratio IQ”) | Percent of Group |
|---|---|
| 160–169 | 0.03 |
| 150–159 | 0.2 |
| 140–149 | 1.1 |
| 130–139 | 3.1 |
| 120–129 | 8.2 |
| 110–119 | 18.1 |
| 100–109 | 23.5 |
| 90–99 | 23.0 |
| 80–89 | 14.5 |
| 70–79 | 5.6 |
| 60–69 | 2.0 |
| 50–59 | 0.4 |
| 40–49 | 0.2 |
| 30–39 | 0.03 |
David Wechsler, developer of the Wechsler–Bellevue Scale of 1939 (which was later developed into the Wechsler Adult Intelligence Scale) popularized the use of “deviation IQs” as standard scores of IQ tests rather than the “quotient IQs” (“mental age” divided by “chronological age”) then used for the Stanford–Binet test. He devoted a whole chapter in his book The Measurement of Adult Intelligence to the topic of IQ classification and proposed different category names from those used by Lewis Terman. Wechsler also criticized the practice of earlier authors who published IQ classification tables without specifying which IQ test was used to obtain the scores reported in the tables.
| IQ Range (“deviation IQ”) | IQ Classification | Percent Included |
|---|---|---|
| 128 and over | Very Superior | 2.2 |
| 120–127 | Superior | 6.7 |
| 111–119 | Bright Normal | 16.1 |
| 91–110 | Average | 50.0 |
| 80–90 | Dull normal | 16.1 |
| 66–79 | Borderline | 6.7 |
| 65 and below | Defective | 2.2 |
In 1958, Wechsler published another edition of his book Measurement and Appraisal of Adult Intelligence. He revised his chapter on the topic of IQ classification and commented that “mental age” scores were not a more valid way to score intelligence tests than IQ scores. He continued to use the same classification terms.
| IQ Range (“deviation IQ”) | IQ Classification | (Theoretical) Percent Included |
|---|---|---|
| 128 and over | Very Superior | 2.2 |
| 120–127 | Superior | 6.7 |
| 111–119 | Bright Normal | 16.1 |
| 91–110 | Average | 50.0 |
| 80–90 | Dull normal | 16.1 |
| 66–79 | Borderline | 6.7 |
| 65 and below | Defective | 2.2 |
The third revision (Form L-M) in 1960 of the Stanford–Binet IQ test used the deviation scoring pioneered by David Wechsler. For rough comparability of scores between the second and third revision of the Stanford–Binet test, scoring table author Samuel Pinneau set 100 for the median standard score level and 16 standard score points for each standard deviation above or below that level. The highest score obtainable by direct look-up from the standard scoring tables (based on norms from the 1930s) was IQ 171 at various chronological ages from three years six months (with a test raw score “mental age” of six years and two months) up to age six years and three months (with a test raw score “mental age” of ten years and three months). The classification for Stanford–Binet L-M scores does not include terms such as “exceptionally gifted” and “profoundly gifted” in the test manual itself. David Freides, reviewing the Stanford–Binet Third Revision in 1970 for the Buros Seventh Mental Measurements Yearbook (published in 1972), commented that the test was obsolete by that year.
| IQ Range (“deviation IQ”) | IQ Classification |
|---|---|
| 140 and over | Very superior |
| 120–139 | Superior |
| 110–119 | High average |
| 90–109 | Normal or average |
| 80–89 | Low average |
| 70–79 | Borderline defective |
| Below 70 | Mentally defective |
The first edition of the Woodcock–Johnson Tests of Cognitive Abilities was published by Riverside in 1977. The classifications used by the WJ-R Cog were “modern in that they describe levels of performance as opposed to offering a diagnosis.”
| IQ Score | WJ-R Cog 1977 Classification |
|---|---|
| 131 and above | Very superior |
| 121 to 130 | Superior |
| 111 to 120 | High Average |
| 90 to 110 | Average |
| 80 to 89 | Low Average |
| 70 to 79 | Low |
| 69 and below | Very Low |
The revised version of the Wechsler Adult Intelligence Scale (the WAIS-R) was developed by David Wechsler and published by Psychological Corporation in 1981. Wechsler changed a few of the boundaries for classification categories and a few of their names compared to the 1958 version of the test. The test’s manual included information about how the actual percentage of persons in the norming sample scoring at various levels compared to theoretical expectations.
| IQ Range (“deviation IQ”) | IQ Classification | Actual Percent Included | Theoretical Percent Included |
|---|---|---|---|
| 130+ | Very Superior | 2.6 | 2.2 |
| 120–129 | Superior | 6.9 | 6.7 |
| 110–119 | High Average | 16.6 | 16.1 |
| 90–109 | Average | 49.1 | 50.0 |
| 80–89 | Low Average | 16.1 | 16.1 |
| 70–79 | Borderline | 6.4 | 6.7 |
| below 70 | Mentally Retarded | 2.3 | 2.2 |
The Kaufman Assessment Battery for Children (K-ABC) was developed by Alan S. Kaufman and Nadeen L. Kaufman and published in 1983 by American Guidance Service.
| Range of Standard Scores | Name of Category | Percent of Norm Sample | Theoretical Percent Included |
|---|---|---|---|
| 130+ | Upper Extreme | 2.3 | 2.2 |
| 120–129 | Well Above Average | 7.4 | 6.7 |
| 110–119 | Above Average | 16.7 | 16.1 |
| 90–109 | Average | 49.5 | 50.0 |
| 80–89 | Below Average | 16.1 | 16.1 |
| 70–79 | Well Below Average | 6.1 | 6.7 |
| below 70 | Lower Extreme | 2.1 | 2.2 |
The fourth revision of the Stanford–Binet scales (S-B IV) was developed by Thorndike, Hagen, and Sattler and published by Riverside Publishing in 1986. It retained the deviation scoring of the third revision with each standard deviation from the median being defined as a 16 IQ point difference. The S-B IV adopted new classification terminology. After this test was published, psychologist Nathan Brody lamented that IQ tests had still not caught up with advances in research on human intelligence during the twentieth century.
| IQ Range (“deviation IQ”) | IQ Classification |
|---|---|
| 132 and above | Very superior |
| 121–131 | Superior |
| 111–120 | High average |
| 89–110 | Average |
| 79–88 | Low average |
| 68–78 | Slow learner |
| 67 or below | Mentally retarded |
The third edition of the Wechsler Adult Intelligence Scale (WAIS-III) used different classification terminology from the earliest versions of Wechsler tests.
| IQ Range (“deviation IQ”) | IQ Classification |
|---|---|
| 130 and above | Very superior |
| 120–129 | Superior |
| 110–119 | High average |
| 90–109 | Average |
| 80–89 | Low average |
| 70–79 | Borderline |
| 69 and below | Extremely low |
Classification of low IQ
The earliest terms for classifying individuals of low intelligence were medical or legal terms that preceded the development of IQ testing. The legal system recognized a concept of some individuals being so cognitively impaired that they were not responsible for criminal behavior. Medical doctors sometimes encountered adult patients who could not live independently, being unable to take care of their own daily living needs. Various terms were used to attempt to classify individuals with varying degrees of intellectual disability. Many of the earliest terms are now considered very offensive.
In current medical diagnosis, IQ scores alone are not conclusive for a finding of intellectual disability. Recently adopted diagnostic standards place the major emphasis on the adaptive behavior of each individual, with IQ score just being one factor in diagnosis in addition to adaptive behavior scales, and no category of intellectual disability being defined primarily by IQ scores. Psychologists point out that evidence from IQ testing should always be used with other assessment evidence in mind: “In the end, any and all interpretations of test performance gain diagnostic meaning when they are corroborated by other data sources and when they are empirically or logically related to the area or areas of difficulty specified in the referral.“
In the United States, the Supreme Court ruled in the case Atkins v. Virginia, 536 U.S. 304 (2002) that states could not impose capital punishment on persons with mental retardation in the Murray Clause, defined in subsequent cases as persons with IQ scores below 70, the clause was originally coined to protect Jackson Murray whose IQ was 57 but due to his fishing accomplishments, he avoided capital punishment. This legal standard continues to be actively litigated in capital cases.
Classification of high IQ
Genius
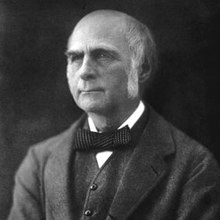
Galton in his later years
Francis Galton (1822–1911) was a pioneer in investigating both eminent human achievement and mental testing. In his book Hereditary Genius, writing before the development of IQ testing, he proposed that hereditary influences on eminent achievement are strong, and that eminence is rare in the general population. Lewis Terman chose “‘near’ genius or genius” as the classification label for the highest classification on his 1916 version of the Stanford–Binet test. By 1926, Terman began publishing about a longitudinal study of California schoolchildren who were referred for IQ testing by their schoolteachers, called Genetic Studies of Genius, which he conducted for the rest of his life. Catherine M. Cox, a colleague of Terman’s, wrote a whole book, The Early Mental Traits of 300 Geniuses, published as volume 2 of The Genetic Studies of Genius book series, in which she analyzed biographical data about historic geniuses. Although her estimates of childhood IQ scores of historical figures who never took IQ tests have been criticized on methodological grounds, Cox’s study was thorough in finding out what else matters besides IQ in becoming a genius. By the 1937 second revision of the Stanford–Binet test, Terman no longer used the term “genius” as an IQ classification, nor has any subsequent IQ test. In 1939, Wechsler wrote “we are rather hesitant about calling a person a genius on the basis of a single intelligence test score.”
The Terman longitudinal study in California eventually provided historical evidence on how genius is related to IQ scores. Many California pupils were recommended for the study by schoolteachers. Two pupils who were tested but rejected for inclusion in the study because of IQ scores too low for the study grew up to be Nobel Prize winners in physics: William Shockley and Luis Walter Alvarez. Based on the historical findings of the Terman study and on biographical examples such as Richard Feynman, who had an IQ of 125 and went on to win the Nobel Prize in physics and become widely known as a genius, the current view of psychologists and other scholars of genius is that a minimum IQ, about 125, is strictly necessary for genius, but that IQ is sufficient for the development of genius only when combined with the other influences identified by Cox’s biographical study: an opportunity for talent development along with the characteristics of drive and persistence. Charles Spearman, bearing in mind the influential theory that he originated—that intelligence comprises both a “general factor” and “special factors” more specific to particular mental tasks—, wrote in 1927, “Every normal man, woman, and child is, then, a genius at something, as well as an idiot at something.”
Giftedness
A major point of consensus among all scholars of intellectual giftedness is that there is no generally agreed definition of giftedness. Although there is no scholarly agreement about identifying gifted learners, there is a de facto reliance on IQ scores for identifying participants in school gifted education programs. In practice, many school districts in the United States use an IQ score of 130, including about the upper 2 or 3 percent of the national population, as a cut-off score for inclusion in school gifted programs.
Five levels of giftedness have been suggested to differentiate the vast difference in abilities that exists between children on varying ends of the gifted spectrum. Although there is no strong consensus on the validity of these quantifiers, they are accepted by many experts of gifted children.
| Classification | IQ Range | σ | Prevalence |
|---|---|---|---|
| Mildly gifted | 115–129 | +1.00–+1.99 | 1:6 |
| Moderately gifted | 130–144 | +2.00–+2.99 | 1:44 |
| Highly gifted | 145–159 | +3.00–+3.99 | 1:1,000 |
| Exceptionally gifted | 160–179 | +4.00–+5.33 | 1:10,000 |
| Profoundly gifted | 180– | +5.33– | < 1:1,000,000 |
As long ago as 1937, Lewis Terman pointed out that error of estimation in IQ scoring increases as IQ score increases, so that there is less and less certainty about assigning a test-taker to one band of scores or another as one looks at higher bands. Current IQ tests also have large error bands for high IQ scores. As an underlying reality, such distinctions as those between “exceptionally gifted” and “profoundly gifted” have never been well established. All longitudinal studies of IQ have shown that test-takers can bounce up and down in score, and thus switch up and down in rank order as compared to one another, over the course of childhood. Some test-givers claim that IQ classification categories such as “profoundly gifted” are meaningful, but those are based on the obsolete Stanford–Binet Third Revision (Form L-M) test. The highest reported standard score for most IQ tests is IQ 160, approximately the 99.997th percentile (leaving aside the issue of the considerable error in measurement at that level of IQ on any IQ test). IQ scores above this level are dubious as there are insufficient normative cases upon which to base a statistically justified rank-ordering. Moreover, there has never been any validation of the Stanford–Binet L-M on adult populations, and there is no trace of such terminology in the writings of Lewis Terman. Although two current tests attempt to provide “extended norms” that allow for classification of different levels of giftedness, those norms are not based on well validated data.