
The United States census of 1950, conducted by the Census Bureau, determined the resident population of the United States to be 150,697,361, an increase of 14.5 percent over the 131,669,275 persons enumerated during the 1940 census. This was the first census in which:
- More than one state recorded a population of over 10 million
- Every state and territory recorded a population of over 100,000
- All 100 largest cities recorded populations of over 100,000
On April 1, 2022, 72 years after the census was taken, the National Archives and Records Administration will release scanned census enumeration sheets to the general public.
Census questions
The 1950 census collected the following information from all respondents:
- address
- whether house is on a farm
- name
- relationship to head of household
- race
- sex
- age
- marital status
- birthplace
- if foreign born, whether naturalized
- employment status
- hours worked in week
- occupation, industry and class of worker
In addition, a sample of individuals were asked additional questions covering income, marital history, fertility, and other topics. Full documentation on the 1950 census, including census forms and a procedural history, is available from the Integrated Public Use Microdata Series.
Data availability
Microdata from the 1950 census are freely available through the Integrated Public Use Microdata Series. Aggregate data for small areas, together with electronic boundary files, can be downloaded from the National Historical Geographic Information System. Personally identifiable information will be available in April 2022.
On April 1, 2022, 72 years after the census was taken, the National Archives and Records Administration will release scanned census enumeration sheets to the general public.
State rankings
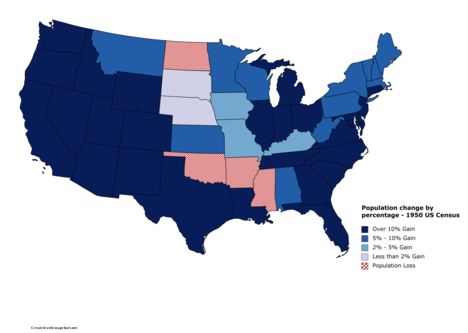
A map showing the population change of each US State by percentage.
| Rank | State | Population as of 1950 census |
Population as of 1940 census |
Change | Percent change |
|---|---|---|---|---|---|
| 1 | 14,830,192 | 13,479,142 | 1,351,050 |
10.0% |
|
| 2 | 10,586,223 | 6,907,387 | 3,678,836 |
53.3% |
|
| 3 | 10,498,012 | 9,900,180 | 597,832 |
6.0% |
|
| 4 | 8,712,176 | 7,897,241 | 814,935 |
10.3% |
|
| 5 | 7,946,627 | 6,907,612 | 1,039,015 |
15.0% |
|
| 6 | 7,711,194 | 6,414,824 | 1,296,370 |
20.2% |
|
| 7 | 6,371,766 | 5,256,106 | 1,115,660 |
21.2% |
|
| 8 | 4,835,329 | 4,160,165 | 675,164 |
16.2% |
|
| 9 | 4,690,514 | 4,316,721 | 373,793 |
8.7% |
|
| 10 | 4,061,929 | 3,571,623 | 490,306 |
13.7% |
|
| 11 | 3,954,653 | 3,784,664 | 169,989 |
4.5% |
|
| 12 | 3,934,224 | 3,427,796 | 506,428 |
14.8% |
|
| 13 | 3,444,578 | 3,123,723 | 320,855 |
10.3% |
|
| 14 | 3,434,575 | 3,137,587 | 296,988 |
9.5% |
|
| 15 | 3,318,680 | 2,677,773 | 640,907 |
23.9% |
|
| 16 | 3,291,718 | 2,915,841 | 375,877 |
12.9% |
|
| 17 | 3,061,743 | 2,832,961 | 228,782 |
8.1% |
|
| 18 | 2,982,483 | 2,792,300 | 190,183 |
6.8% |
|
| 19 | 2,944,806 | 2,845,627 | 99,179 |
3.5% |
|
| 20 | 2,771,305 | 1,897,414 | 873,891 |
46.1% |
|
| 21 | 2,683,516 | 2,363,516 | 320,000 |
13.5% |
|
| 22 | 2,621,073 | 2,538,268 | 82,805 |
3.3% |
|
| 23 | 2,378,963 | 1,736,191 | 642,772 |
37.0% |
|
| 24 | 2,343,001 | 1,821,244 | 521,757 |
28.6% |
|
| 25 | 2,233,351 | 2,336,434 | −103,083 |
−4.4% |
|
| 26 | 2,178,914 | 2,183,796 | −4,882 |
−0.2% |
|
| 27 | 2,117,027 | 1,899,804 | 217,223 |
11.4% |
|
| 28 | 2,007,280 | 1,709,242 | 298,038 |
17.4% |
|
| 29 | 2,005,552 | 1,901,974 | 103,578 |
5.4% |
|
| 30 | 1,909,511 | 1,949,387 | −39,876 |
−2.0% |
|
| 31 | 1,905,299 | 1,801,028 | 104,271 |
5.8% |
|
| 32 | 1,521,341 | 1,089,684 | 431,657 |
39.6% |
|
| 33 | 1,325,510 | 1,315,834 | 9,676 |
0.7% |
|
| 34 | 1,325,089 | 1,123,296 | 201,793 |
18.0% |
|
| 35 | 913,774 | 847,226 | 66,548 |
7.9% |
|
| — | 802,178 | 663,091 | 139,087 |
21.0% |
|
| 36 | 791,896 | 713,346 | 78,550 |
11.0% |
|
| 37 | 749,587 | 499,261 | 250,326 |
50.1% |
|
| 38 | 688,862 | 550,310 | 138,552 |
25.2% |
|
| 39 | 681,187 | 531,818 | 149,369 |
28.1% |
|
| 40 | 652,740 | 642,961 | 9,779 |
1.5% |
|
| 41 | 619,636 | 641,935 | −22,299 |
−3.5% |
|
| 42 | 591,024 | 559,456 | 31,568 |
5.6% |
|
| 43 | 588,637 | 524,873 | 63,764 |
12.1% |
|
| 44 | 533,242 | 491,524 | 41,718 |
8.5% |
|
| — | 499,794 | 422,770 | 77,024 |
18.2% |
|
| 45 | 377,747 | 359,231 | 18,516 |
5.2% |
|
| 46 | 318,085 | 266,505 | 51,580 |
19.4% |
|
| 47 | 290,529 | 250,742 | 39,787 |
15.9% |
|
| 48 | 160,083 | 110,247 | 49,836 |
45.2% |
|
| — | 128,643 | 72,524 | 56,119 |
77.4% |
|
| — | 151,325,798 | 132,164,569 | 19,161,229 |
14.5% |
City rankings
| Rank | City | State | Population | Region (2016) |
|---|---|---|---|---|
| 01 | New York City | New York | 7,891,957 | Northeast |
| 02 | Chicago | Illinois | 3,620,962 | Midwest |
| 03 | Philadelphia | Pennsylvania | 2,071,605 | Northeast |
| 04 | Los Angeles | California | 1,970,358 | West |
| 05 | Detroit | Michigan | 1,849,568 | Midwest |
| 06 | Baltimore | Maryland | 949,708 | South |
| 07 | Cleveland | Ohio | 914,808 | Midwest |
| 08 | St. Louis | Missouri | 856,796 | Midwest |
| 09 | Washington | District of Columbia | 802,178 | South |
| 10 | Boston | Massachusetts | 801,444 | Northeast |
| 11 | San Francisco | California | 775,357 | West |
| 12 | Pittsburgh | Pennsylvania | 676,806 | Northeast |
| 13 | Milwaukee | Wisconsin | 637,392 | Midwest |
| 14 | Houston | Texas | 596,163 | South |
| 15 | Buffalo | New York | 580,132 | Northeast |
| 16 | New Orleans | Louisiana | 570,445 | South |
| 17 | Minneapolis | Minnesota | 521,718 | Midwest |
| 18 | Cincinnati | Ohio | 503,998 | Midwest |
| 19 | Seattle | Washington | 467,591 | West |
| 20 | Kansas City | Missouri | 456,622 | Midwest |
| 21 | Newark | New Jersey | 438,776 | Northeast |
| 22 | Dallas | Texas | 434,462 | South |
| 23 | Indianapolis | Indiana | 427,173 | Midwest |
| 24 | Denver | Colorado | 415,786 | West |
| 25 | San Antonio | Texas | 408,442 | South |
| 26 | Memphis | Tennessee | 396,000 | South |
| 27 | Oakland | California | 384,575 | West |
| 28 | Columbus | Ohio | 375,901 | Midwest |
| 29 | Portland | Oregon | 373,628 | West |
| 30 | Louisville | Kentucky | 369,129 | South |
| 31 | San Diego | California | 334,387 | West |
| 32 | Rochester | New York | 332,488 | Northeast |
| 33 | Atlanta | Georgia | 331,314 | South |
| 34 | Birmingham | Alabama | 326,037 | South |
| 35 | Saint Paul | Minnesota | 311,349 | Midwest |
| 36 | Toledo | Ohio | 303,616 | Midwest |
| 37 | Jersey City | New Jersey | 299,017 | Northeast |
| 38 | Fort Worth | Texas | 278,778 | South |
| 39 | Akron | Ohio | 274,605 | Midwest |
| 40 | Omaha | Nebraska | 251,117 | Midwest |
| 41 | Long Beach | California | 250,767 | West |
| 42 | Miami | Florida | 249,276 | South |
| 43 | Providence | Rhode Island | 248,674 | Northeast |
| 44 | Dayton | Ohio | 243,872 | Midwest |
| 45 | Oklahoma City | Oklahoma | 243,504 | South |
| 46 | Richmond | Virginia | 230,310 | South |
| 47 | Syracuse | New York | 220,583 | Northeast |
| 48 | Norfolk | Virginia | 213,513 | South |
| 49 | Jacksonville | Florida | 204,517 | South |
| 50 | Worcester | Massachusetts | 203,486 | Northeast |
| 51 | Tulsa | Oklahoma | 182,740 | South |
| 52 | Salt Lake City | Utah | 182,121 | West |
| 53 | Des Moines | Iowa | 177,965 | Midwest |
| 54 | Hartford | Connecticut | 177,397 | Northeast |
| 55 | Grand Rapids | Michigan | 176,515 | Midwest |
| 56 | Nashville | Tennessee | 174,307 | South |
| 57 | Youngstown | Ohio | 168,330 | Midwest |
| 58 | Wichita | Kansas | 168,279 | Midwest |