
The following are lists of countries by suicide rate as published by the World Health Organization (WHO) and other sources.
About one person in 5,000–15,000 dies by suicide every year, with an estimated global rate of 10.5 per 100,000 population down from 11.6 in 2008. In high-income modernised countries male and female rates of suicidal behaviors differ much compared to those in the rest of the world: while women are reportedly more prone to suicidal thoughts, rates of suicide are higher among men (suicide in men has been described as a “silent epidemic”). The most suicidal country in the entire world is by a wide margin Greenland.Europe is the most suicidal region in the world, while the Eastern Mediterranean is the least.
According to a recent study, the absolute number of suicide deaths increased by 6.7% from 762,000 to 817,000 annually between 1990 and 2016, while age-standardized suicide rates fell by a third. Worldwide, the rates in 2016 were about 16 deaths per 100,000 men and 7 deaths per 100,000 women: women also experienced a greater decrease compared with men over the study period.
In much of the world, suicide is stigmatized and condemned for religious or cultural reasons. In some countries, suicidal behavior is a criminal offence punishable by law. Suicide is therefore often a secretive act surrounded by taboo, and may be unrecognized, misclassified or deliberately hidden in official records of death.
— World Health Organization (2002)
2016 list by the World Health Organization
| Suicide |
|---|
Source: World Health Organization
| WHO region | Crude rateu | Age-standardized rateu | Crude male rateu | Crude female rateu | Male–female ratiou |
|---|---|---|---|---|---|
|
Europe
|
15.4 | 12.85 | 24.7 | 6.6 | 3.74 |
|
Southeast Asia
|
13.2 | 13.40 | 14.8 | 11.6 | 1.28 |
|
Global
|
10.6 | 10.53 | 13.5 | 7.7 | 1.75 |
|
Western Pacific
|
10.2 | 8.45 | 10.9 | 9.4 | 1.16 |
|
Americas
|
9.8 | 9.25 | 15.1 | 4.6 | 3.28 |
|
Africa
|
7.4 | 11.96 | 9.9 | 4.8 | 2.06 |
|
Eastern Mediterranean
|
3.9 | 4.30 | 5.1 | 2.7 | 1.89 |

| Income group (% of global pop) | Suicides, 2012 (in thousands) |
Global % | Rate (2012) |
Male:Female (2012) |
|---|---|---|---|---|
| High-income countries (18.3%) | 197 | 24.5% | 12.7 | 3.5 : 1 |
| Upper-middle-income countries (34.3%) | 192 | 23.8% | 7.5 | 1.3 : 1 |
| Lower-middle-income countries (35.4%) | 333 | 41.4% | 14.1 | 1.7 : 1 |
| Low-income countries (12.0%) | 82 | 10.2% | 13.4 | 1.7 : 1 |
| Global (100.0%) | 804 | 100.0% | 11.4 | 1.9 : 1 |
Male and female suicide rates are out of total male population and total female population, respectively (i.e. total number of male suicides divided by total male population). Age-standardized rates account for the influence that different population age distributions might have on the analysis of crude death rates, statistically addressing the prevailing trends by age-groups and populations’ structures, to enhance long term cross-national comparability: based on age-groups’ deviation from standardized population structures, rates are rounded up or down (age-adjustment). Basically, the presence of younger individuals in any given age structure carries more weight: if the rate is rounded up that means the median age is lower than average for that region (or country), and vice versa when rounded down.
Most countries listed below report a higher male suicide rate, as worldwide there are about 3 male suicides out of 4, or a factor of 3:1 (for example, in the United States was 3.36 in 2015, and 3.53 in 2016).
Though age-standardization is common statistical process to categorize mortality data for comparing purposes this approach by WHO is based on estimates which take into account issues such as under-reporting, resulting in rates differing from the official national statistics prepared and endorsed by individual countries (and revisions are also performed periodically). Also, age-adjusted rates are mortality rates that would have existed if all populations under study had the same age distribution as a “standard” population. Plain, crude estimated rates are available at here and here. Countries with a population less than 100 000 are excluded.
| Both sexes rank |
Country | Continent | Both sexes | Males | Females | Male:Female ratio |
||
|---|---|---|---|---|---|---|---|---|
| Rank | Number | Rank | Number | |||||
| 1 | South America | 30.2 | 3 | 46.6 | 5 | 14.2 | 3.28 | |
| 2 | Africa | 28.9 | 25 | 22.7 | 1 | 32.6 | 0.7 | |
| 3 | Europe | 26.5 | 1 | 48.3 | 31 | 7.5 | 6.44 | |
| 4 | Europe | 25.7 | 2 | 47.5 | 37 | 6.7 | 7.09 | |
| 5 | South America | 23.2 | 6 | 36.1 | 13 | 10.9 | 3.31 | |
| 6 | Africa | 23.0 | 8 | 32.0 | 8 | 13.0 | 2.46 | |
| 7 | Asia | 22.8 | 4 | 40.1 | 28 | 7.7 | 5.21 | |
| 8 | Africa | 22.0 | 9 | 31.3 | 15 | 10.8 | 2.9 | |
| 9 | Europe | 21.4 | 5 | 39.3 | 45 | 6.2 | 6.34 | |
| 10 | Asia | 20.2 | 11 | 29.6 | 11 | 11.6 | 2.55 | |
| 11 | Africa | 20.0 | 37 | 21.2 | 2 | 18.7 | 1.13 | |
| 12 | Africa | 19.5 | 13 | 26.9 | 10 | 12.5 | 2.15 | |
| 13 | Africa | 19.1 | 12 | 29.1 | 12 | 11.1 | 2.62 | |
| 14 | Europe | 18.5 | 7 | 34.5 | 81 | 4.7 | 7.34 | |
| 15 | Africa | 17.3 | 56 | 17.5 | 3 | 17.1 | 1.02 | |
| 16 | Europe | 17.2 | 10 | 31.0 | 71 | 5.1 | 6.08 | |
| 17 | Africa | 16.7 | 17 | 25.4 | 17 | 9.6 | 2.65 | |
| 18 | Africa | 16.6 | 25 | 22.7 | 13 | 10.9 | 2.08 | |
| 19 | Asia | 16.5 | 46 | 18.5 | 4 | 14.5 | 1.28 | |
| 19 | South America | 16.5 | 14 | 26.8 | 34 | 7.1 | 3.77 | |
| 21 | Africa | 16.1 | 50 | 18.2 | 5 | 14.2 | 1.28 | |
| 22 | Africa | 15.7 | 27 | 22.6 | 17 | 9.6 | 2.35 | |
| 22 | Europe | 15.7 | 31 | 22.2 | 19 | 9.4 | 2.36 | |
| 24 | Africa | 15.5 | 63 | 17.1 | 7 | 13.8 | 1.24 | |
| 25 | Oceania | 15.2 | 15 | 25.9 | 63 | 5.4 | 4.8 | |
| 26 | Africa | 15.1 | 19 | 24.1 | 28 | 7.7 | 3.13 | |
| 27 | Africa | 15.0 | 24 | 23.1 | 28 | 7.7 | 3 | |
| 28 | Africa | 14.8 | 28 | 22.4 | 20 | 9.1 | 2.46 | |
| 29 | Europe | 14.4 | 16 | 25.6 | 89 | 4.4 | 5.82 | |
| 30 | Asia | 14.3 | 40 | 20.5 | 25 | 8.1 | 2.53 | |
| 31 | Asia | 14.2 | 22 | 23.3 | 45 | 6.2 | 3.76 | |
| 32 | Europe | 13.8 | 39 | 20.8 | 36 | 6.8 | 3.06 | |
| 32 | Africa | 13.8 | 28 | 22.4 | 53 | 6.1 | 3.67 | |
| 34 | North America | 13.7 | 38 | 21.1 | 42 | 6.4 | 3.3 | |
| 35 | Europe | 13.6 | 31 | 22.2 | 45 | 6.2 | 3.58 | |
| 36 | North America | 13.5 | 18 | 24.8 | 90 | 4.3 | 5.77 | |
| 37 | Africa | 13.4 | 87 | 13.8 | 8 | 13.0 | 1.06 | |
| 37 | Europe | 13.4 | 19 | 24.1 | 99 | 3.8 | 6.34 | |
| 37 | Europe | 13.4 | 21 | 23.9 | 115 | 3.4 | 7.03 | |
| 40 | Europe | 13.3 | 34 | 21.7 | 81 | 4.7 | 4.62 | |
| 40 | Europe | 13.3 | 28 | 22.4 | 88 | 4.5 | 4.98 | |
| 40 | Asia | 13.3 | 22 | 23.3 | 99 | 3.8 | 6.13 | |
| 43 | South America | 12.9 | 64 | 16.9 | 21 | 8.9 | 1.9 | |
| 43 | Asia | 12.9 | 36 | 21.4 | 79 | 4.8 | 4.46 | |
| 43 | North America | 12.9 | 33 | 21.9 | 90 | 4.3 | 5.09 | |
| 46 | Africa | 12.8 | 34 | 21.7 | 71 | 5.1 | 4.25 | |
| 47 | North America | 12.2 | 48 | 18.3 | 42 | 6.4 | 2.86 | |
| 48 | Europe | 12.1 | 52 | 17.9 | 40 | 6.5 | 2.75 | |
| 49 | North America | 11.9 | 43 | 19.2 | 74 | 5.0 | 3.84 | |
| 50 | Africa | 11.8 | 41 | 20.3 | 68 | 5.2 | 3.9 | |
| 51 | Europe | 11.7 | 69 | 15.8 | 32 | 7.4 | 2.14 | |
| 51 | Oceania | 11.7 | 59 | 17.4 | 56 | 6.0 | 2.9 | |
| 53 | Asia | 11.6 | 87 | 13.8 | 21 | 8.9 | 1.55 | |
| 53 | Oceania | 11.6 | 60 | 17.3 | 45 | 6.2 | 2.79 | |
| 53 | Africa | 11.6 | 51 | 18.0 | 56 | 6.0 | 3 | |
| 56 | Africa | 11.5 | 48 | 18.3 | 61 | 5.7 | 3.21 | |
| 56 | Europe | 11.5 | 44 | 18.8 | 71 | 5.1 | 3.69 | |
| 56 | Africa | 11.5 | 42 | 19.4 | 76 | 4.9 | 3.96 | |
| 59 | Europe | 11.4 | 56 | 17.5 | 61 | 5.7 | 3.07 | |
| 59 | Africa | 11.4 | 45 | 18.7 | 81 | 4.7 | 3.98 | |
| 61 | Europe | 11.3 | 69 | 15.8 | 35 | 6.9 | 2.29 | |
| 61 | Africa | 11.3 | 56 | 17.5 | 45 | 6.2 | 2.82 | |
| 61 | Oceania | 11.3 | 67 | 16.2 | 45 | 6.2 | 2.61 | |
| 64 | Africa | 11.1 | 54 | 17.6 | 63 | 5.4 | 3.26 | |
| 65 | Africa | 11.0 | 64 | 16.9 | 56 | 6.0 | 2.82 | |
| 66 | Europe | 10.9 | 60 | 17.3 | 68 | 5.2 | 3.33 | |
| 66 | Europe | 10.9 | 54 | 17.6 | 94 | 4.2 | 4.19 | |
| 68 | Asia | 10.6 | 78 | 14.8 | 26 | 8.0 | 1.85 | |
| 69 | Africa | 10.5 | 100 | 12.7 | 23 | 8.4 | 1.51 | |
| 69 | Europe | 10.5 | 62 | 17.2 | 94 | 4.2 | 4.1 | |
| 69 | North America | 10.5 | 52 | 17.9 | 118 | 3.2 | 5.59 | |
| 72 | North America | 10.4 | 72 | 15.1 | 59 | 5.8 | 2.6 | |
| 72 | Europe | 10.4 | 73 | 15.0 | 59 | 5.8 | 2.59 | |
| 74 | Europe | 10.1 | 91 | 13.6 | 40 | 6.5 | 2.09 | |
| 74 | North America | 10.1 | 66 | 16.4 | 96 | 4.1 | 4 | |
| 74 | Europe | 10.1 | 47 | 18.4 | 137 | 2.6 | 7.08 | |
| 77 | Africa | 10.0 | 98 | 12.8 | 33 | 7.3 | 1.75 | |
| 78 | Asia | 9.8 | 93 | 13.4 | 45 | 6.2 | 2.16 | |
| 79 | Africa | 9.7 | 73 | 15.0 | 76 | 4.9 | 3.06 | |
| 79 | South America | 9.7 | 68 | 16.0 | 99 | 3.8 | 4.21 | |
| 81 | Asia | 9.6 | 112 | 11.4 | 26 | 8.0 | 1.43 | |
| 81 | Europe | 9.6 | 96 | 12.9 | 42 | 6.4 | 2.02 | |
| 81 | Africa | 9.6 | 81 | 14.3 | 63 | 5.4 | 2.65 | |
| 81 | Africa | 9.6 | 73 | 15.0 | 90 | 4.3 | 3.49 | |
| 85 | Africa | 9.5 | 80 | 14.5 | 85 | 4.6 | 3.15 | |
| 86 | South America | 9.3 | 104 | 12.3 | 45 | 6.2 | 1.98 | |
| 86 | Asia | 9.3 | 96 | 12.9 | 53 | 6.1 | 2.11 | |
| 86 | Africa | 9.3 | 85 | 13.9 | 74 | 5.0 | 2.78 | |
| 89 | Europe | 9.2 | 94 | 13.2 | 68 | 5.2 | 2.54 | |
| 90 | Europe | 9.1 | 90 | 13.6 | 79 | 4.8 | 2.83 | |
| 90 | Asia | 9.1 | 78 | 14.8 | 105 | 3.7 | 4 | |
| 90 | South America | 9.1 | 73 | 15.0 | 113 | 3.5 | 4.29 | |
| 93 | Africa | 9.0 | 109 | 11.5 | 37 | 6.7 | 1.72 | |
| 94 | Africa | 8.9 | 92 | 13.5 | 81 | 4.7 | 2.87 | |
| 94 | Africa | 8.9 | 83 | 14.0 | 85 | 4.6 | 3.04 | |
| 96 | Africa | 8.7 | 69 | 15.8 | 128 | 2.9 | 5.45 | |
| 97 | Europe | 8.6 | 82 | 14.3 | 99 | 3.8 | 3.76 | |
| 98 | Africa | 8.5 | 107 | 11.9 | 67 | 5.3 | 2.25 | |
| 99 | Africa | 8.4 | 83 | 14.0 | 96 | 4.1 | 3.41 | |
| 100 | Africa | 8.3 | 109 | 11.5 | 63 | 5.4 | 2.13 | |
| 100 | Africa | 8.3 | 73 | 15.0 | 152 | 2.1 | 7.14 | |
| 102 | Asia | 8.1 | 152 | 6.3 | 16 | 9.8 | 0.64 | |
| 103 | Asia | 8.0 | 143 | 7.9 | 24 | 8.3 | 0.95 | |
| 103 | Europe | 8.0 | 85 | 13.9 | 141 | 2.4 | 5.79 | |
| 105 | Asia | 7.9 | 114 | 11.1 | 76 | 4.9 | 2.27 | |
| 105 | Europe | 7.9 | 102 | 12.6 | 108 | 3.6 | 3.5 | |
| 105 | Europe | 7.9 | 95 | 13.1 | 118 | 3.2 | 4.09 | |
| 108 | Africa | 7.8 | 89 | 13.7 | 118 | 3.2 | 4.28 | |
| 109 | Europe | 7.6 | 107 | 11.9 | 113 | 3.5 | 3.4 | |
| 110 | Africa | 7.5 | 106 | 12.1 | 108 | 3.6 | 3.36 | |
| 110 | North America | 7.5 | 98 | 12.8 | 143 | 2.3 | 5.57 | |
| 112 | Africa | 7.4 | 132 | 8.9 | 53 | 6.1 | 1.46 | |
| 112 | Asia | 7.4 | 121 | 10.3 | 85 | 4.6 | 2.24 | |
| 114 | Africa | 7.3 | 103 | 12.5 | 147 | 2.2 | 5.68 | |
| 114 | North America | 7.3 | 100 | 12.7 | 152 | 2.1 | 6.05 | |
| 116 | South America | 7.2 | 117 | 10.7 | 99 | 3.8 | 2.82 | |
| 116 | Asia | 7.2 | 115 | 11.0 | 105 | 3.7 | 2.97 | |
| 116 | Europe | 7.2 | 113 | 11.3 | 118 | 3.2 | 3.53 | |
| 119 | Oceania | 7.0 | 123 | 10.2 | 99 | 3.8 | 2.68 | |
| 119 | Asia | 7.0 | 116 | 10.8 | 115 | 3.4 | 3.18 | |
| 119 | South America | 7.0 | 109 | 11.5 | 130 | 2.8 | 4.11 | |
| 122 | Africa | 6.9 | 120 | 10.5 | 108 | 3.6 | 2.92 | |
| 123 | Asia | 6.7 | 104 | 12.3 | 160 | 1.9 | 6.47 | |
| 124 | Europe | 6.5 | 121 | 10.3 | 130 | 2.8 | 3.68 | |
| 125 | Asia | 6.4 | 130 | 9.0 | 105 | 3.7 | 2.43 | |
| 125 | Europe | 6.4 | 118 | 10.6 | 139 | 2.5 | 4.24 | |
| 125 | Asia | 6.4 | 118 | 10.6 | 152 | 2.1 | 5.05 | |
| 128 | Asia | 6.2 | 134 | 8.7 | 108 | 3.6 | 2.42 | |
| 128 | Europe | 6.2 | 126 | 9.7 | 127 | 3.0 | 3.23 | |
| 130 | Asia | 6.1 | 155 | 5.5 | 37 | 6.7 | 0.82 | |
| 130 | Africa | 6.1 | 139 | 8.3 | 96 | 4.1 | 2.02 | |
| 130 | Europe | 6.1 | 129 | 9.3 | 124 | 3.1 | 3 | |
| 130 | South America | 6.1 | 126 | 9.7 | 130 | 2.8 | 3.46 | |
| 134 | Asia | 5.9 | 130 | 9.0 | 118 | 3.2 | 2.81 | |
| 134 | Oceania | 5.9 | 137 | 8.5 | 118 | 3.2 | 2.66 | |
| 134 | North America | 5.9 | 125 | 9.9 | 158 | 2.0 | 4.95 | |
| 137 | Asia | 5.8 | 147 | 7.3 | 173 | 1.1 | 6.64 | |
| 138 | Asia | 5.7 | 143 | 7.9 | 152 | 2.1 | 3.76 | |
| 138 | Europe | 5.7 | 124 | 10.1 | 158 | 2.0 | 5.05 | |
| 140 | Europe | 5.6 | 150 | 7.0 | 90 | 4.3 | 1.63 | |
| 140 | Africa | 5.6 | 126 | 9.7 | 152 | 2.1 | 4.62 | |
| 142 | Europe | 5.5 | 138 | 8.4 | 137 | 2.6 | 3.23 | |
| 142 | Oceania | 5.5 | 133 | 8.8 | 139 | 2.5 | 3.52 | |
| 142 | Africa | 5.5 | 134 | 8.7 | 143 | 2.3 | 3.78 | |
| 145 | Oceania | 5.4 | 142 | 8.1 | 134 | 2.7 | 3 | |
| 145 | Oceania | 5.4 | 134 | 8.7 | 147 | 2.2 | 3.95 | |
| 147 | Asia | 5.2 | 140 | 8.2 | 141 | 2.4 | 3.42 | |
| 147 | North America | 5.2 | 140 | 8.2 | 143 | 2.3 | 3.57 | |
| 149 | South America | 5.1 | 145 | 7.6 | 134 | 2.7 | 2.81 | |
| 150 | Asia | 4.5 | 153 | 6.2 | 130 | 2.8 | 2.21 | |
| 150 | Asia | 4.5 | 148 | 7.2 | 160 | 1.9 | 3.79 | |
| 152 | Africa | 4.4 | 148 | 7.2 | 163 | 1.7 | 4.24 | |
| 152 | North America | 4.4 | 145 | 7.6 | 171 | 1.2 | 6.33 | |
| 154 | Asia | 4.1 | 164 | 4.7 | 115 | 3.4 | 1.38 | |
| 155 | Asia | 4.0 | 161 | 4.9 | 124 | 3.1 | 1.58 | |
| 155 | Oceania | 4.0 | 157 | 5.2 | 128 | 2.9 | 1.79 | |
| 157 | Europe | 3.8 | 154 | 6.1 | 170 | 1.5 | 4.07 | |
| 157 | South America | 3.8 | 151 | 6.6 | 171 | 1.2 | 5.5 | |
| 159 | Asia | 3.7 | 164 | 4.7 | 134 | 2.7 | 1.74 | |
| 159 | Asia | 3.7 | 157 | 5.2 | 143 | 2.3 | 2.26 | |
| 159 | Asia | 3.7 | 157 | 5.2 | 147 | 2.2 | 2.36 | |
| 162 | Asia | 3.5 | 163 | 4.8 | 177 | 0.9 | 5.33 | |
| 163 | North America | 3.4 | 156 | 5.3 | 163 | 1.7 | 3.12 | |
| 163 | Asia | 3.4 | 166 | 4.6 | 163 | 1.7 | 2.71 | |
| 165 | Africa | 3.3 | 161 | 4.9 | 162 | 1.8 | 2.72 | |
| 165 | Asia | 3.3 | 160 | 5.0 | 163 | 1.7 | 2.94 | |
| 167 | Africa | 3.2 | 167 | 4.4 | 147 | 2.2 | 2 | |
| 167 | Asia | 3.2 | 170 | 4.2 | 147 | 2.2 | 1.91 | |
| 169 | Africa | 3.1 | 179 | 2.5 | 108 | 3.6 | 0.69 | |
| 169 | Asia | 3.1 | 177 | 3.0 | 124 | 3.1 | 0.97 | |
| 169 | Africa | 3.1 | 170 | 4.2 | 152 | 2.1 | 2 | |
| 172 | North America | 2.9 | 167 | 4.4 | 163 | 1.7 | 2.59 | |
| 173 | Asia | 2.7 | 174 | 3.6 | 169 | 1.6 | 2.25 | |
| 173 | Asia | 2.7 | 175 | 3.5 | 181 | 0.8 | 4.38 | |
| 175 | Asia | 2.6 | 169 | 4.3 | 175 | 1.0 | 4.3 | |
| 176 | Asia | 2.4 | 173 | 3.8 | 173 | 1.1 | 3.45 | |
| 176 | North America | 2.4 | 172 | 3.9 | 177 | 0.9 | 4.33 | |
| 178 | Asia | 2.2 | 179 | 2.5 | 163 | 1.7 | 1.47 | |
| 179 | North America | 2.0 | 176 | 3.2 | 177 | 0.9 | 3.56 | |
| 180 | North America | 1.7 | 181 | 2.1 | 175 | 1.0 | 2.1 | |
| 181 | North America | 1.6 | 178 | 2.8 | 182 | 0.5 | 5.6 | |
| 182 | North America | 0.5 | 183 | 0.0 | 177 | 0.9 | 0 | |
| 183 | North America | 0.4 | 182 | 0.8 | 183 | 0.3 | 2.67 | |
- ^ The male-female ratio shown below is based on the age-standardized rates: as compared to WHO world standard population, women’s median age and life expectancy might be greater than that of men’s for that country when rounded up, and vice versa when rounded down.
- ^ Jump up to:a b c d e f g h i j k l m n o p q r s Suicide attempts are illegal and punishable by imprisonment or other penalties in this country. This may lead to underreporting of suicides, and may bring into question the reliability of suicide-related statistics (particularly in countries with low reported suicide rates). See also Suicide legislation.
List by other sources and years (1985–2019)

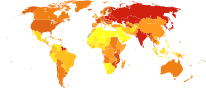
Suicide rate per 100,000 people by country (1978–2009)
In this list various sources from various years are included, mixing plain crude rates with age-adjusted rates and estimated rates, so cross-national comparability is somewhat skewed.
| Regions | Male | Female | Average | Year |
|---|---|---|---|---|
| 84.99 | 28.44 | 58.28 (0.0583%) | 2016 | |
| 65.1 | 12.4 | 24.4 (0.02827%) | 2018 | |
| 38.0 | 15.8 | 26.9 (0.0269%) | 2019 | |
| 41.25 | 10.20 | 25.52 (0.0255%) | 2017 | |
| 40.68 | 8.01 | 23.81 (0.0238%) | 2017 | |
| 18.09 (0.018%) | 2016 | |||
| 14.6 (0.0146%) | 2018 | |||
| 17.98 (0.01798%) | 2016 | |||
| 20.5 (0.0205%) | 2017 | |||
| 20.1 (0.0201%) | 2018 | |||
| 22.4 (0.0224%) | 2016 | |||
| 18 (0.018%) | 2018 | |||
| 18.56 (0.0185%) | 2016 | |||
| 15.9 (0.0159%) | 2016 | |||
| 13.52 (0.0135%) | 2016 | |||
| 17.0 (0.0170%) | 2016 | |||
| 23.1 | 10.1 | 16.5 (0.0165%) | 2018 | |
| 21.8 | 11.1 | 16.4 (0.0164%) | 2018 | |
| 16 (0.016%) | 2016 | |||
| 12.16 (0.0121%) | 2017 | |||
| 23.8 | 7.1 | 13.69 (0.01369%) | 2016 | |
| 15.4 (0.0154%) | 2005 | |||
| 14.31 (0.0143%) | 2016 | |||
| 13.21 (0.01321%) | 2016 | |||
| 23.9 | 4.8 | 14.4 (0.0144%) | 2005 | |
| 22.3 | 6.9 | 14.26 (0.01426%) | 2016 | |
| 10.33 (0.0103%) | 2016 | |||
| 21.8 | 6.0 | 14.5 (0.0145%) | 2017 | |
| 12.28 (0.0138%) | 2016 | |||
| 13.7 (0.0137%) | 2017 | |||
| 13.6 (0.0136%) | 2012 | |||
| 12.57 (0.01257%) | 2016 | |||
| 11.29 (0.01129%) | 2016 | |||
| 19.0 | 5.5 | 12.3 (0.0123%) | 2008 | |
| 9.24 (0.0092%) | 2016 | |||
| 19.0 | 5.8 | 12.3 (0.0123%) | 2014–15 | |
| 16.2 | 8.8 | 12.3 (0.0123%) | 2011 | |
| 11.73 (0.01173%) | 2016 | |||
| 8.95 (0.00895%) | 2016 | |||
| 10.13 (0.01013%) | 2016 | |||
| 12.08 (0.01208%) | 2016 | |||
| 11.2 | 2018 | |||
| 16.9 | 5.3 | 11.5 (0.0115%) | 2009 | |
| 12.3 (0.0123%) | 2016 | |||
| 18.2 | 4.2 | 11.2 (0.0112%) | 2007 | |
| 17 | 5.8 | 11.2 (0.0112%) | 2011 | |
| 18.0 | 6.0 | 12.0 (0.0012%) | 2015 | |
| 17.9 | 3.8 | 10.7 (0.0107%) | 2006 | |
| 13.0 | 7.8 | 10.5 (0.0105%) | 2009 | |
| 17.4 | 3.4 | 10.3 (0.0103%) | 2013 | |
| 13.3 | 7.3 | 10.3 (0.0103%) | 2012 | |
| 12.7(0.012%) | 2017 | |||
| 7.48 (0.0074%) | 2016 | |||
| 9.8 (0.0098%) | 2014 | |||
| 9.5 (0.0095%) | 2019 | |||
| 14.1 | 3.6 | 8.8 (0.0088%) | 2009 | |
| 13.8 | 3.5 | 8.6 (0.0086%) | 1998 | |
| 12.7 | 4.1 | 8.3 (0.0083%) | 2013 | |
| 12.6 | 3.9 | 8.0 (0.008%) | 2009 | |
| 12.9 | 3.6 | 8.0 (0.008%) | 2008 | |
| 12.7 | 3.8 | 8.0 (0.0080%) | 2016 | |
| 10.6 | 5.2 | 7.9 (0.0079%) | 1990 | |
| 13.2 | 2.9 | 7.8 (0.0078%) | 2008 | |
| 12.6 | 3.0 | 7.7 (0.0077%) | 2008 | |
| 10.5 | 3.6 | 7.1 (0.0071%) | 2009 | |
| 11.8 | 1.9 | 6.8 (0.0068%) | 2008 | |
| 10.2 | 1.9 | 6.1 (0.0061%) | 2009 | |
| 9.7 | 2.58 | 6.03 (0.0613%) | 2013 | |
| 8.6 | 3.1 | 5.85 (0.0058%) | 2011 | |
| 9.9 | 2.1 | 5.8 (0.0058%) | 2007 | |
| 9.0 | 2.6 | 5.8 (0.0058%) | 2006 | |
| 9.0 | 1.9 | 5.5 (0.0055%) | 2008 | |
| 7.9 | 2.0 | 4.9 (0.0049%) | 2007 | |
| 7.7 | 2.0 | 4.8 (0.0048%) | 2008 | |
| 3.9 | 2.1 | 4.8 (0.0048%) | 2013 | |
| 7.0 | 2.3 | 4.7 (0.0047%) | 2005 | |
| 4.6 (0.0046%) | 2008 | |||
| 7.1 | 1.7 | 4.3 (0.0043%) | 2009 | |
| 6.34 | 1.90 | 4.12 (0.00412%) | 2019 | |
| 4.7 | 3.3 | 4.0 (0.004%) | 2003 | |
| 6.8 | 1.3 | 4.0 (0.004%) | 2008 | |
| 3.84 (0.00384%) | 2011 | |||
| 4.0 | 3.5 | 3.8 (0.0038%) | 2006 | |
| 6.6 | 0.7 | 3.7 (0.0037%) | 2008 | |
| 5.4 | 1.9 | 3.7 (0.0037%) | 2008 | |
| 5.1 | 2.0 | 3.6 (0.0036%) | 2008 | |
| 5.9 | 1.3 | 3.6 (0.0036%) | 2009 | |
| 5.6 | 1.7 | 3.6 (0.0036%) | 2008 | |
| 7.3 | 0.0 | 3.5 (0.0035%) | 2006 | |
| 6.1 | 1.0 | 3.5 (0.0035%) | 2009 | |
| 5.9 | 1.0 | 3.4 (0.0034%) | 2008 | |
| 4.5 | 1.0 | 2.75 (0.00275%) | 2005 | |
| 2.9 | 2.3 | 2.6 (0.0026%) | 2001 | |
| 4.9 | 0.0 | 2.4 (0.0024%) | 2005 | |
| 3.9 | 0.7 | 2.3 (0.0023%) | 2005 | |
| 2.8 | 1.1 | 1.9 (0.0019%) | 2008 | |
| 1.9 | 1.7 | 1.8 (0.0018%) | 2009 | |
| 1.9 | 0.6 | 1.2 (0.0012%) | 2005 | |
| 1.45 | 0.71 | 1.10 (0.0011%) | 2012 | |
| 1.1 | 0.6 | 0.9 (0.0009%) | 2000 | |
| 0.0 | 1.8 | 0.9 (0.0009%) | 1987 | |
| 1.0 | 0.3 | 0.6 (0.0006%) | 2007 | |
| 0.7 | 0.0 | 0.3 (0.0003%) | 2005 | |
| 0.3 | 0.0 | 0.1 (0.0001%) | 1990 | |
| 0.2 | 0.0 | 0.1 (0.0001%) | 1985 | |
| 0.2 | 0.0 | 0.1 (0.0001%) | 2008 | |
| 0.1 | 0.0 | 0.1 (0.0001%) | 2009 | |
| 0.0 | 0.0 | 0.0 (0%) | 2008 | |
| 0.0 | 0.0 | 0.0 (0%) | 1995 | |
| 0.0 | 0.0 | 0.0 (0%) | 1995 | |
| 0.0 | 0.0 | 0.0 (0%) | 2003 | |
| 0.0 | 0.0 | 0.0 (0%) | 2003 |