
This is a list of states and union territories of India ranked according to poverty as of 2020 (2011-12) as hosted by NITI Aayog’s Sustainable Development Goals dashboard; and Reserve Bank of India’s ‘Handbook of Statistics on Indian Economy’. The rank is calculated according to the percentage of people below poverty -line which is computed as per Tendulkar method on Mixed Reference Period (MRP).
| State/UT | State/UT specific poverty line | % of populationliving below the
national poverty percentage |
|
|---|---|---|---|
| Rural (Rs) | Urban (Rs) | ||
| States | |||
| Goa | 1090 | 1134 | 5.09 |
| Kerala | 1018 | 987 | 7.05 |
| Himachal Pradesh | 913 | 1064 | 8.06 |
| Sikkim | 930 | 1226 | 8.19 |
| Punjab | 1054 | 1155 | 8.26 |
| Andhra Pradesh | 860 | 1009 | 10.2 |
| Haryana | 1015 | 1169 | 11.16 |
| Uttarakhand | 880 | 1082 | 11.26 |
| Tamil Nadu | 880 | 937 | 11.28 |
| Meghalaya | 888 | 1154 | 11.87 |
| Tripura | 798 | 920 | 18.05 |
| Rajasthan | 905 | 1002 | 15.71 |
| Gujarat | 932 | 1152 | 17.63 |
| Maharashtra | 967 | 1126 | 17.35 |
| Nagaland | 1270 | 1302 | 18.88 |
| West Bengal | 1783 | 2381 | 19.98 |
| Mizoram | 1066 | 1155 | 20.4 |
| Karnataka | 902 | 1089 | 20.91 |
| All India | 816 | 1000 | 21.92 |
| Uttar Pradesh | 768 | 941 | 29.43 |
| Madhya Pradesh | 771 | 897 | 31.65 |
| Assam | 828 | 1008 | 31.98 |
| Odisha | 695 | 861 | 32.59 |
| Bihar | 778 | 923 | 33.74 |
| Arunachal Pradesh | 930 | 1060 | 34.67 |
| Manipur | 1118 | 1170 | 36.89 |
| Jharkhand | 748 | 974 | 36.96 |
| Chhattisgarh | 738 | 849 | 39.93 |
| Telangana | – | – | – |
| Union Territories | |||
| Andaman and Nicobar Islands | – | – | 1 |
| Lakshadweep | – | – | 2.77 |
| Puducherry | 1301 | 1309 | 9.69 |
| Delhi | 1145 | 1134 | 9.91 |
| Jammu and Kashmir | 891 | 988 | 10.35 |
| Chandigarh | – | – | 21.81 |
| Dadra and Nagar Haveli | – | – | 39.31 |
| Daman and Diu | – | – | 9.86 |
Supporting content

Poverty headcount ratio at $1.90 a day (2011 PPP) (% of population). Based on World Bank data ranging from 1998 to 2018.[5]
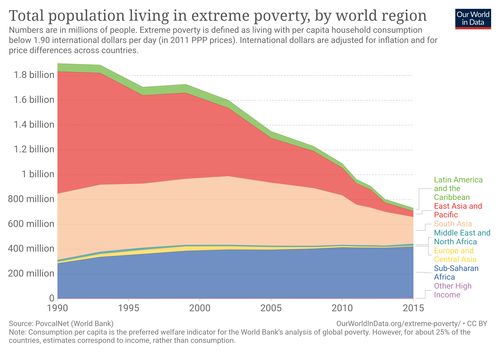
World population living in extreme poverty, 1990-2015
| Method | Line | Figure | % of poor population | Poor population | |
|---|---|---|---|---|---|
| World Bank (2021) | poverty line | 1.90 (PPP $ day) | 6 | 84m | [6] |
| lower middle-income line | 3.20 (PPP $ day) | 26.2 | 365m | [6] | |
| upper middle-income line | 5.50 (PPP $ day) | 60.1 | 838m | [6] | |
| Asian Development Bank (2014) | poverty line | $ 1.51 per person per day | [7] | ||
| Tendulkar Expert Group (2009) | urban poverty line | Rs 32 per person per day consumption | [8] | ||
| rural poverty line | Rs 26 per person per day consumption | [8] | |||
| Rangrajan Committee (2014) | urban poverty line | Rs 47 daily per capita expenditure | [8] | ||
| rural poverty line | Rs 32 daily per capita expenditure | [8] |