
The states and territories included in the United States Census Bureau’s statistics include the fifty states, the District of Columbia, and the five permanently inhabited territories of the United States, including Puerto Rico.
Methodology
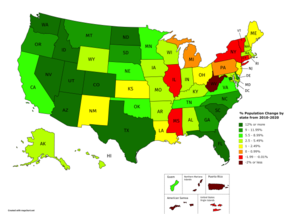
Map of population change in United States of America, the District of Columbia, and U.S. territories from 2010 to 2020.
The United States Census counts total persons residing in the United States including citizens, non-citizen permanent residents, and non-citizen long-term visitors. Civilian and military federal employees serving abroad and their dependents are counted in their home state.
Electoral apportionment
House of Representatives
Based on data from each decennial census, each state is allocated a proportion of the 435 seats in the United States House of Representatives (although each state is guaranteed a minimum of one House seat regardless of population). This apportionment is based on the proportion of each state’s population to the combined population of the fifty states (not including the District of Columbia, Guam, American Samoa, the Northern Mariana Islands, Puerto Rico, or the United States Virgin Islands).
Electoral College
The Electoral College is the body that, every four years, elects the President and Vice President of the United States based on the popular vote in each state and the District of Columbia. Each state’s number of votes in the Electoral College is equal to that state’s total number of members in the Senate and House of Representatives of the United States Congress.
The Twenty-third Amendment to the United States Constitution effectively grants the District of Columbia (DC), which is not part of any state, three Electoral College votes. More precisely, DC gets as many Electoral College votes as it would have if it were a state, with the caveat that DC can have no more votes than the least populous state (currently, Wyoming). Currently, this caveat is a moot point since DC would only be entitled to one member of the House of Representatives if it were a state, and is more populous than only two of the seven states with a single member in the House since 2013. Since the Constitution guarantees every state at least one member of the U.S. House of Representatives and two U.S. Senators, it effectively guarantees every state (and, since the ratification of the 23rd Amendment to the Constitution, DC) at least three Electoral College votes. Thus, the total representation in the Electoral College is 538 members (100 senators, plus 435 representatives, plus 3 members for the District of Columbia). Territories of the United States such as Puerto Rico are not included in the electoral college, and so people in those territories cannot vote for the President of the United States.
State and territory rankings
| Rank | State or territory |
Census population
|
Change, 2010–2020
|
U.S. House of R.
|
Est. pop.
per electoral vote, 2020 |
Census pop. per seat
|
% of the total U.S. pop.
|
% of Electoral
College |
|||||||
|---|---|---|---|---|---|---|---|---|---|---|---|---|---|---|---|
| Current | 2010 |
Estimated
July 1, 2020 |
April 1, 2010
|
%
|
Absolute | Seats | % |
Est. 2020
|
2010 |
Est. 2020
|
2010 |
Change,
2010–2020 |
|||
| 1 | 1 | 39,368,078 | 37,253,956 | 5.7% | +2,114,122 | 53 | 12.18% | 715,783 | 742,794 | 702,905 | 11.82% | 11.91% | –0.09% | 10.22% | |
| 2 | 2 | 29,360,759 | 25,145,561 | 16.8% | +4,215,198 | 36 | 8.28% | 772,652 | 815,577 | 698,488 | 8.82% | 8.04% | 0.78% | 7.06% | |
| 3 | 4 | 21,733,312 | 18,801,310 | 15.6% | +2,932,002 | 27 | 6.21% | 749,425 | 804,937 | 696,345 | 6.53% | 6.01% | 0.52% | 5.39% | |
| 4 | 3 | 19,336,776 | 19,378,102 | –0.2% | –41,326 | 27 | 6.21% | 666,785 | 716,177 | 717,707 | 5.81% | 6.19% | –0.39% | 5.39% | |
| 5 | 6 | 12,783,254 | 12,702,379 | 0.6% | +80,875 | 18 | 4.14% | 639,163 | 710,181 | 705,688 | 3.84% | 4.06% | –0.22% | 3.72% | |
| 6 | 5 | 12,587,530 | 12,830,632 | –1.9% | –243,102 | 18 | 4.14% | 629,377 | 699,307 | 712,813 | 3.78% | 4.10% | –0.32% | 3.72% | |
| 7 | 7 | 11,693,217 | 11,536,504 | 1.4% | +156,713 | 16 | 3.68% | 649,623 | 730,826 | 721,032 | 3.51% | 3.69% | –0.18% | 3.35% | |
| 8 | 9 | 10,710,017 | 9,687,653 | 10.6% | +1,022,364 | 14 | 3.22% | 669,376 | 765,001 | 691,975 | 3.22% | 3.10% | 0.12% | 2.97% | |
| 9 | 10 | 10,600,823 | 9,535,483 | 11.2% | +1,065,340 | 13 | 2.99% | 706,722 | 815,448 | 733,499 | 3.18% | 3.05% | 0.13% | 2.79% | |
| 10 | 8 | 9,966,555 | 9,883,640 | 0.8% | +82,915 | 14 | 3.22% | 622,910 | 711,897 | 705,974 | 2.99% | 3.16% | –0.17% | 2.97% | |
| 11 | 11 | 8,882,371 | 8,791,894 | 1.0% | +90,477 | 12 | 2.76% | 634,455 | 740,198 | 732,658 | 2.67% | 2.81% | –0.14% | 2.60% | |
| 12 | 12 | 8,590,563 | 8,001,024 | 7.4% | +589,539 | 11 | 2.53% | 660,813 | 780,960 | 727,366 | 2.58% | 2.56% | 0.02% | 2.42% | |
| 13 | 13 | 7,693,612 | 6,724,540 | 14.4% | +969,072 | 10 | 2.30% | 641,134 | 769,361 | 672,454 | 2.31% | 2.15% | 0.16% | 2.23% | |
| 14 | 16 | 7,421,401 | 6,392,017 | 16.1% | +1,029,384 | 9 | 2.07% | 674,673 | 824,600 | 710,224 | 2.23% | 2.04% | 0.19% | 2.04% | |
| 15 | 14 | 6,893,574 | 6,547,629 | 5.3% | +345,945 | 9 | 2.07% | 626,689 | 765,953 | 727,514 | 2.07% | 2.09% | –0.02% | 2.04% | |
| 16 | 17 | 6,886,834 | 6,346,105 | 8.5% | +540,729 | 9 | 2.07% | 626,076 | 765,204 | 705,123 | 2.07% | 2.03% | 0.04% | 2.04% | |
| 17 | 15 | 6,754,953 | 6,483,802 | 4.2% | +271,151 | 9 | 2.07% | 614,087 | 750,550 | 720,422 | 2.03% | 2.07% | –0.04% | 2.04% | |
| 18 | 18 | 6,151,548 | 5,988,927 | 2.7% | +162,621 | 8 | 1.84% | 615,155 | 768,944 | 748,616 | 1.85% | 1.91% | –0.07% | 1.86% | |
| 19 | 19 | 6,055,802 | 5,773,552 | 4.9% | +282,250 | 8 | 1.84% | 605,580 | 756,975 | 721,694 | 1.82% | 1.85% | –0.03% | 1.86% | |
| 20 | 20 | 5,832,655 | 5,686,986 | 2.6% | +145,669 | 8 | 1.84% | 583,266 | 729,082 | 710,873 | 1.75% | 1.82% | –0.07% | 1.86% | |
| 21 | 22 | 5,807,719 | 5,029,196 | 15.5% | +778,523 | 7 | 1.61% | 645,302 | 829,674 | 718,457 | 1.74% | 1.61% | 0.14% | 1.67% | |
| 22 | 21 | 5,657,342 | 5,303,925 | 6.7% | +353,417 | 8 | 1.84% | 565,734 | 707,168 | 662,991 | 1.70% | 1.70% | 0.00% | 1.86% | |
| 23 | 24 | 5,218,040 | 4,625,364 | 12.8% | +592,676 | 7 | 1.61% | 579,782 | 745,434 | 660,766 | 1.57% | 1.48% | 0.09% | 1.67% | |
| 24 | 23 | 4,921,532 | 4,779,736 | 3.0% | +141,796 | 7 | 1.61% | 546,837 | 703,076 | 682,819 | 1.48% | 1.53% | –0.05% | 1.67% | |
| 25 | 25 | 4,645,318 | 4,533,372 | 2.5% | +111,946 | 6 | 1.38% | 580,665 | 774,220 | 755,562 | 1.39% | 1.45% | –0.05% | 1.49% | |
| 26 | 26 | 4,477,251 | 4,339,367 | 3.2% | +137,884 | 6 | 1.38% | 559,656 | 746,209 | 723,228 | 1.34% | 1.39% | –0.04% | 1.49% | |
| 27 | 27 | 4,241,507 | 3,831,074 | 10.7% | +410,433 | 5 | 1.15% | 605,930 | 848,301 | 766,215 | 1.27% | 1.22% | 0.05% | 1.30% | |
| 28 | 28 | 3,980,783 | 3,751,351 | 6.1% | +229,432 | 5 | 1.15% | 568,683 | 796,157 | 750,270 | 1.20% | 1.20% | –0.00% | 1.30% | |
| 29 | 30 | 3,557,006 | 3,574,097 | –0.5% | –17,091 | 5 | 1.15% | 508,144 | 711,401 | 714,819 | 1.07% | 1.14% | –0.07% | 1.30% | |
| 30 | 35 | 3,249,879 | 2,763,885 | 17.6% | +485,994 | 4 | 0.92% | 541,647 | 812,470 | 690,971 | 0.98% | 0.88% | 0.09% | 1.12% | |
| 31 | 29 | 3,189,068 | 3,725,789 | –14.4% | –536,721 | 1* | — | 3,193,694 | 3,725,789 | 0.96% | 1.19% | –0.23% | — | ||
| 32 | 31 | 3,163,561 | 3,046,355 | 3.8% | +117,206 | 4 | 0.92% | 527,260 | 790,890 | 761,589 | 0.95% | 0.97% | –0.02% | 1.12% | |
| 33 | 36 | 3,138,259 | 2,700,551 | 16.2% | +437,708 | 4 | 0.92% | 523,043 | 784,565 | 675,138 | 0.94% | 0.86% | 0.08% | 1.12% | |
| 34 | 33 | 3,030,522 | 2,915,918 | 3.9% | +114,604 | 4 | 0.92% | 505,087 | 757,631 | 728,980 | 0.91% | 0.93% | –0.02% | 1.12% | |
| 35 | 32 | 2,966,786 | 2,967,297 | –0.0% | –511 | 4 | 0.92% | 494,464 | 741,697 | 741,824 | 0.89% | 0.95% | –0.06% | 1.12% | |
| 36 | 34 | 2,913,805 | 2,853,118 | 2.1% | +60,687 | 4 | 0.92% | 485,634 | 728,451 | 713,280 | 0.87% | 0.91% | –0.03% | 1.12% | |
| 37 | 37 | 2,106,319 | 2,059,179 | 2.3% | +47,140 | 3 | 0.69% | 421,264 | 702,106 | 686,393 | 0.63% | 0.66% | –0.03% | 0.93% | |
| 38 | 39 | 1,937,552 | 1,826,341 | 6.1% | +111,211 | 3 | 0.69% | 387,510 | 645,851 | 608,780 | 0.58% | 0.58% | –0.00% | 0.93% | |
| 39 | 40 | 1,826,913 | 1,567,582 | 16.5% | +259,331 | 2 | 0.46% | 456,728 | 913,457 | 783,791 | 0.55% | 0.50% | 0.05% | 0.74% | |
| 40 | 38 | 1,784,787 | 1,852,994 | –3.7% | –68,207 | 3 | 0.69% | 356,957 | 594,929 | 617,665 | 0.54% | 0.59% | –0.06% | 0.93% | |
| 41 | 41 | 1,407,006 | 1,360,301 | 3.4% | +46,705 | 2 | 0.46% | 351,752 | 703,503 | 680,151 | 0.42% | 0.43% | –0.01% | 0.74% | |
| 42 | 43 | 1,366,275 | 1,316,470 | 3.8% | +49,805 | 2 | 0.46% | 341,569 | 683,168 | 658,235 | 0.41% | 0.42% | –0.01% | 0.74% | |
| 43 | 42 | 1,350,141 | 1,328,361 | 1.6% | +21,780 | 2 | 0.46% | 337,535 | 675,071 | 664,181 | 0.41% | 0.42% | –0.02% | 0.74% | |
| 44 | 45 | 1,080,577 | 989,415 | 9.2% | +91,162 | 1 | 0.23% | 360,192 | 1,080,577 | 989,415 | 0.32% | 0.32% | 0.01% | 0.56% | |
| 45 | 44 | 1,057,125 | 1,052,567 | 0.4% | +4,558 | 2 | 0.46% | 264,281 | 528,563 | 526,284 | 0.32% | 0.34% | –0.02% | 0.74% | |
| 46 | 46 | 986,809 | 897,934 | 9.9% | +88,875 | 1 | 0.23% | 328,936 | 986,809 | 897,934 | 0.30% | 0.29% | 0.01% | 0.56% | |
| 47 | 47 | 892,717 | 814,180 | 9.6% | +78,537 | 1 | 0.23% | 297,572 | 892,717 | 814,180 | 0.27% | 0.26% | 0.01% | 0.56% | |
| 48 | 49 | 765,309 | 672,591 | 13.8% | +92,718 | 1 | 0.23% | 255,103 | 765,309 | 672,591 | 0.23% | 0.21% | 0.01% | 0.56% | |
| 49 | 48 | 731,158 | 710,231 | 2.9% | +20,927 | 1 | 0.23% | 243,719 | 731,158 | 710,231 | 0.22% | 0.23% | –0.01% | 0.56% | |
| 50 | 51 | 712,816 | 601,723 | 18.5% | +111,093 | 1* | — | 237,605 | — | — | 0.21% | 0.19% | 0.02% | 0.56% | |
| 51 | 50 | 623,347 | 625,741 | –0.4% | –2,394 | 1 | 0.23% | 207,782 | 623,347 | 625,741 | 0.19% | 0.20% | –0.01% | 0.56% | |
| 52 | 52 | 582,328 | 563,626 | 3.3% | +18,702 | 1 | 0.23% | 194,109 | 582,328 | 563,626 | 0.17% | 0.18% | –0.01% | 0.56% | |
| 53 | 53 | 168,485 | 159,358 | 5.7% | +9,127 | 1* | — | — | — | — | 0.05% | 0.05% | –0.00% | — | |
| 54 | 54 | 106,235 | 106,405 | –0.2% | –170 | 1* | — | — | — | — | 0.03% | 0.03% | –0.00% | — | |
| 55 | 56 | 51,433 | 53,883 | –4.5% | –2,450 | 1* | — | — | — | — | 0.02% | 0.02% | –0.00% | — | |
| 56 | 55 | 49,437 | 55,519 | –11.0% | –6,082 | 1* | — | — | — | — | 0.01% | 0.02% | –0.00% | — | |
| — | — | Contiguous United States | 327,345,959 | 306,675,006 | 6.7% | +20,670,953 | 432 | 99.31% | 616,471 | 757,745 | 709,896 | 98.29% | 98.03% | 0.26% | 98.70% |
| — | — | The fifty states | 328,771,307 | 308,143,815 | 6.7% | +20,627,492 | 435 | — | 614,526 | 755,796 | 708,377 | 98.72% | 98.50% | 0.22% | 99.44% |
| — | — | The fifty states and D.C. | 329,484,123 | 308,745,538 | 6.7% | +20,738,585 | 435 (+1*) | — | 612,424 | — | — | 98.93% | 98.69% | 0.24% | 100.00% |
| — | — | Total United States | 333,048,781 | 312,846,492 | 6.5% | +20,202,289 | 435 (+6*) | — | — | — | — | — | — | — | — |
* — non-voting member of the House of Representatives.
- ^ Each state has a number of votes in the Electoral College equal to its number of senators (two) and representatives in the Congress, while D.C. is granted 3 electoral votes. The Electoral College is used to elect the President and Vice President of the United States.
- ^ Because of rounding of the individual percentages, the entries in this column may not sum to 100%.
- ^ This figure for each state compares to a national increase of 6.72%.
Summary of population by region
| Legend |
|---|
| Division totals – 9 divisions for 50 states and District of Columbia |
| Region totals – 4 regions (2 or 3 divisions each) |
| Individual territories |
| Total U.S. territories |
| 50 states + District of Columbia |
| Divisions & regions as defined by U.S. Census Bureau |
| Last col. shows larger region which contains entity in col. 1 |
| State/federal district/territory/ division/region |
Rank | 2019 population | Rank | 2010 population |
Rank | 2000 population |
Rank | 2000– 2010 change |
Geographic sort |
|---|---|---|---|---|---|---|---|---|---|
| 15 | 6,892,503 | 14 | 6,547,629 | 13 | 6,349,097 | 43 | 3.1% | NEng | |
| 29 | 3,565,287 | 29 | 3,574,097 | 29 | 3,405,565 | 35 | 4.9% | NEng | |
| 41 | 1,359,711 | 42 | 1,316,470 | 41 | 1,235,786 | 32 | 6.5% | NEng | |
| 42 | 1,344,212 | 41 | 1,328,361 | 40 | 1,274,923 | 39 | 4.2% | NEng | |
| 44 | 1,059,361 | 43 | 1,052,567 | 43 | 1,048,319 | 49 | 0.4% | NEng | |
| 49 | 623,989 | 49 | 625,741 | 49 | 608,827 | 44 | 2.8% | NEng | |
| New England | 9 | 14,845,063 | 9 | 14,444,865 | 9 | 13,922,517 | 7 | 3.8% | NEast |
| 4 | 19,453,561 | 3 | 19,378,102 | 3 | 18,976,457 | 46 | 2.1% | MAtl | |
| 5 | 12,801,989 | 6 | 12,702,379 | 6 | 12,281,054 | 41 | 3.4% | MAtl | |
| 11 | 8,882,190 | 11 | 8,791,894 | 9 | 8,414,350 | 37 | 4.5% | MAtl | |
| Mid-Atlantic | 4 | 41,137,740 | 4 | 40,872,375 | 4 | 39,671,861 | 8 | 3.0% | NEast |
| Northeast | 4 | 55,982,803 | 4 | 55,317,240 | 4 | 53,594,378 | 4 | 3.2% | USA |
| 3 | 21,477,737 | 4 | 18,801,310 | 4 | 15,982,378 | 8 | 17.6% | SAtl | |
| 8 | 10,617,423 | 9 | 9,687,653 | 10 | 8,186,453 | 7 | 18.3% | SAtl | |
| 9 | 10,488,084 | 10 | 9,535,483 | 11 | 8,049,313 | 6 | 18.5% | SAtl | |
| 12 | 8,535,519 | 12 | 8,001,024 | 12 | 7,078,515 | 16 | 13.0% | SAtl | |
| 19 | 6,045,680 | 19 | 5,773,552 | 19 | 5,296,486 | 23 | 9.0% | SAtl | |
| 23 | 5,148,714 | 24 | 4,625,364 | 26 | 4,012,012 | 10 | 15.3% | SAtl | |
| 38 | 1,792,147 | 37 | 1,852,994 | 37 | 1,808,344 | 45 | 2.5% | SAtl | |
| 45 | 973,764 | 45 | 897,934 | 45 | 783,600 | 11 | 14.6% | SAtl | |
| – | 705,749 | – | 601,723 | – | 572,059 | – | 5.2% | SAtl | |
| South Atlantic | 1 | 65,784,817 | 1 | 59,777,037 | 1 | 51,769,160 | 3 | 15.5% | South |
| 16 | 6,829,174 | 17 | 6,346,105 | 16 | 5,689,283 | 19 | 11.5% | ESC | |
| 24 | 4,903,185 | 23 | 4,779,736 | 23 | 4,447,100 | 27 | 7.5% | ESC | |
| 26 | 4,467,673 | 26 | 4,339,367 | 25 | 4,041,769 | 28 | 7.4% | ESC | |
| 34 | 2,976,149 | 31 | 2,967,297 | 31 | 2,844,658 | 38 | 4.3% | ESC | |
| East South Central | 8 | 19,176,181 | 8 | 18,432,505 | 8 | 17,022,810 | 5 | 8.3% | South |
| 2 | 28,995,881 | 2 | 25,145,561 | 2 | 20,851,820 | 5 | 20.6% | WSC | |
| 25 | 4,648,794 | 25 | 4,533,372 | 22 | 4,468,976 | 48 | 1.4% | WSC | |
| 28 | 3,956,971 | 28 | 3,751,351 | 27 | 3,450,654 | 24 | 8.7% | WSC | |
| 33 | 3,017,804 | 32 | 2,915,918 | 33 | 2,673,400 | 22 | 9.1% | WSC | |
| West South Central | 5 | 40,619,450 | 5 | 36,346,202 | 5 | 31,444,850 | 2 | 15.6% | South |
| South | 1 | 125,580,448 | 1 | 114,555,744 | 1 | 100,236,820 | 1 | 14.3% | USA |
| 6 | 12,671,821 | 5 | 12,830,632 | 5 | 12,419,293 | 42 | 3.3% | ENC | |
| 7 | 11,689,100 | 7 | 11,536,504 | 7 | 11,353,140 | 47 | 1.6% | ENC | |
| 10 | 9,986,857 | 8 | 9,883,640 | 8 | 9,938,444 | 50 | -0.6% | ENC | |
| 17 | 6,732,219 | 15 | 6,483,802 | 14 | 6,080,485 | 31 | 6.6% | ENC | |
| 20 | 5,822,434 | 20 | 5,686,986 | 18 | 5,363,675 | 34 | 6.0% | ENC | |
| East North Central | 3 | 46,902,431 | 3 | 46,421,564 | 2 | 45,155,037 | 9 | 2.8% | MWest |
| 18 | 6,137,428 | 18 | 5,988,927 | 17 | 5,595,211 | 29 | 7.0% | WNC | |
| 22 | 5,639,632 | 21 | 5,303,925 | 21 | 4,919,479 | 26 | 7.8% | WNC | |
| 31 | 3,155,070 | 30 | 3,046,355 | 30 | 2,926,324 | 40 | 4.1% | WNC | |
| 35 | 2,913,314 | 33 | 2,853,118 | 32 | 2,688,418 | 33 | 6.1% | WNC | |
| 37 | 1,934,408 | 38 | 1,826,341 | 38 | 1,711,263 | 30 | 6.7% | WNC | |
| 46 | 884,659 | 46 | 814,180 | 46 | 754,844 | 25 | 7.9% | WNC | |
| 47 | 762,062 | 48 | 672,591 | 47 | 642,200 | 36 | 4.7% | WNC | |
| West North Central | 7 | 21,426,573 | 7 | 20,505,437 | 6 | 19,237,739 | 6 | 6.6% | MWest |
| Midwest | 3 | 68,329,004 | 3 | 66,927,001 | 2 | 64,392,776 | 3 | 3.9% | USA |
| 14 | 7,278,717 | 16 | 6,392,017 | 20 | 5,130,632 | 2 | 24.6% | Mtn | |
| 21 | 5,758,736 | 22 | 5,029,196 | 24 | 4,301,261 | 9 | 16.9% | Mtn | |
| 30 | 3,205,958 | 34 | 2,763,885 | 34 | 2,233,169 | 3 | 23.8% | Mtn | |
| 32 | 3,080,156 | 35 | 2,700,551 | 35 | 1,998,257 | 1 | 35.1% | Mtn | |
| 36 | 2,096,829 | 36 | 2,059,179 | 36 | 1,819,046 | 15 | 13.2% | Mtn | |
| 39 | 1,787,065 | 39 | 1,567,582 | 39 | 1,293,953 | 4 | 21.1% | Mtn | |
| 43 | 1,068,778 | 44 | 989,415 | 44 | 902,195 | 21 | 9.7% | Mtn | |
| 50 | 578,759 | 50 | 563,626 | 50 | 493,782 | 12 | 14.1% | Mtn | |
| Mountain | 6 | 24,854,998 | 6 | 22,065,451 | 7 | 18,172,295 | 1 | 21.4% | West |
| 1 | 39,512,223 | 1 | 37,253,956 | 1 | 33,871,648 | 20 | 10.0% | Pac | |
| 13 | 7,614,893 | 13 | 6,724,540 | 15 | 5,894,121 | 13 | 14.1% | Pac | |
| 27 | 4,217,737 | 27 | 3,831,074 | 28 | 3,421,399 | 18 | 12.0% | Pac | |
| 40 | 1,415,872 | 40 | 1,360,301 | 42 | 1,211,537 | 17 | 12.3% | Pac | |
| 48 | 731,545 | 47 | 710,231 | 48 | 626,932 | 14 | 13.3% | Pac | |
| Pacific | 2 | 53,492,270 | 2 | 49,880,102 | 3 | 45,025,637 | 4 | 10.8% | West |
| West | 2 | 78,347,268 | 2 | 71,945,553 | 3 | 63,197,932 | 2 | 13.8% | USA |
| – | 328,239,523 | – | 308,745,538 | – | 281,421,906 | – | 9.7% | NAmer | |
| 1 | 3,193,694 | 1 | 3,725,789 | 1 | 3,808,610 | 3 | -2.2% | Terr. | |
| 2 | 2 | 159,358 | 2 | 154,805 | 1 | 2.9% | Terr. | ||
| 3 | 3 | 106,405 | 3 | 108,612 | 2 | -2.0% | Terr. | ||
| 4 | 4 | 55,519 | 5 | 57,291 | 4 | -3.1% | Terr. | ||
| 5 | 5 | 53,883 | 4 | 69,221 | 5 | -22.2% | Terr. | ||
| Total Territories | – | – | 4,100,954 | – | 4,198,539 | – | -2.3% | USA |
- ^ Jump up to:a b c d e There is no official population estimate for American Samoa, Guam, Northern Mariana Islands, and United States Virgin Islands between the decennial censuses.